Devon Energy Corporation's management explains the business in its own materials. The slides below do the most of that work, pulled from the documents preserved in Sources. Each source link opens the complete presentation at that slide in a new tab.
The first full statement of the combined Devon-Coterra company: guidance, capital allocation, synergy pace and portfolio direction. · Open the full document →
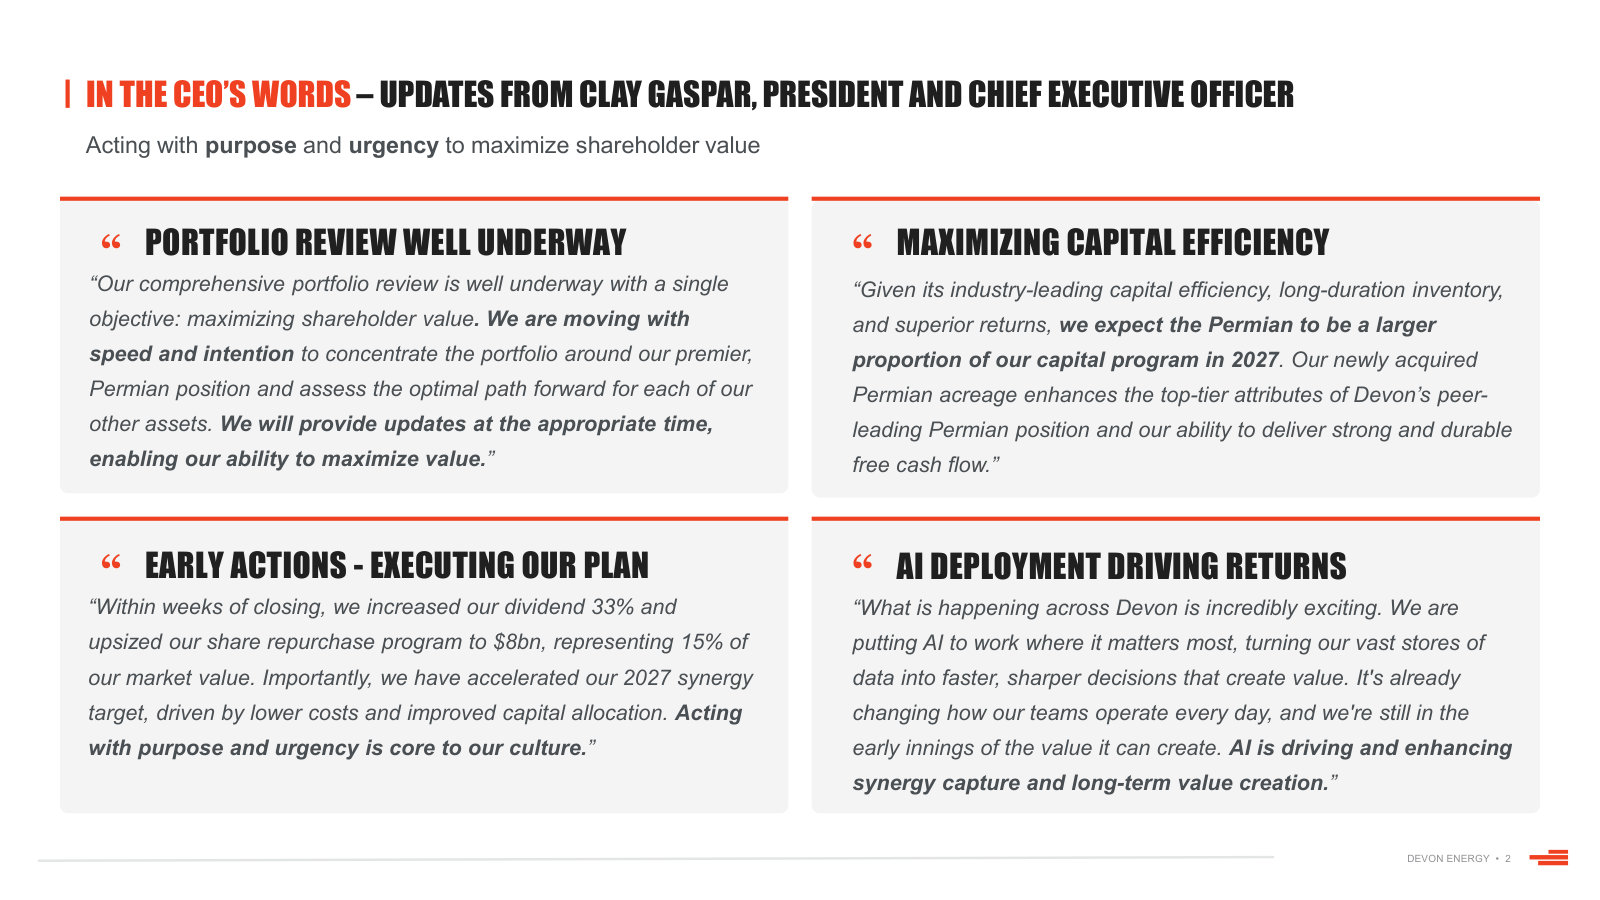
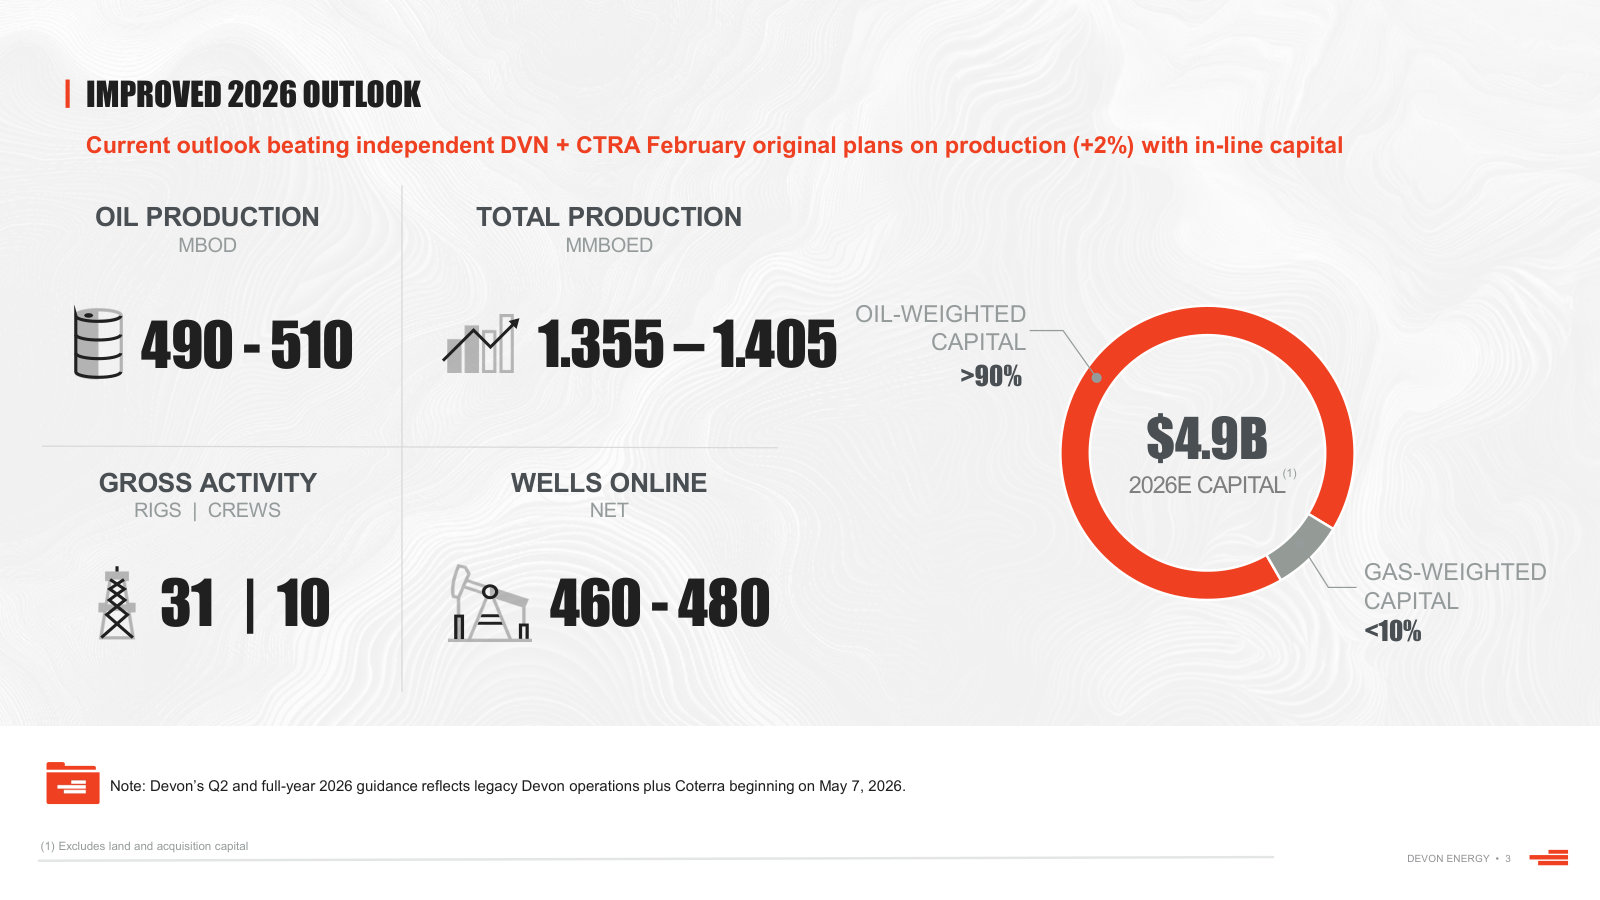
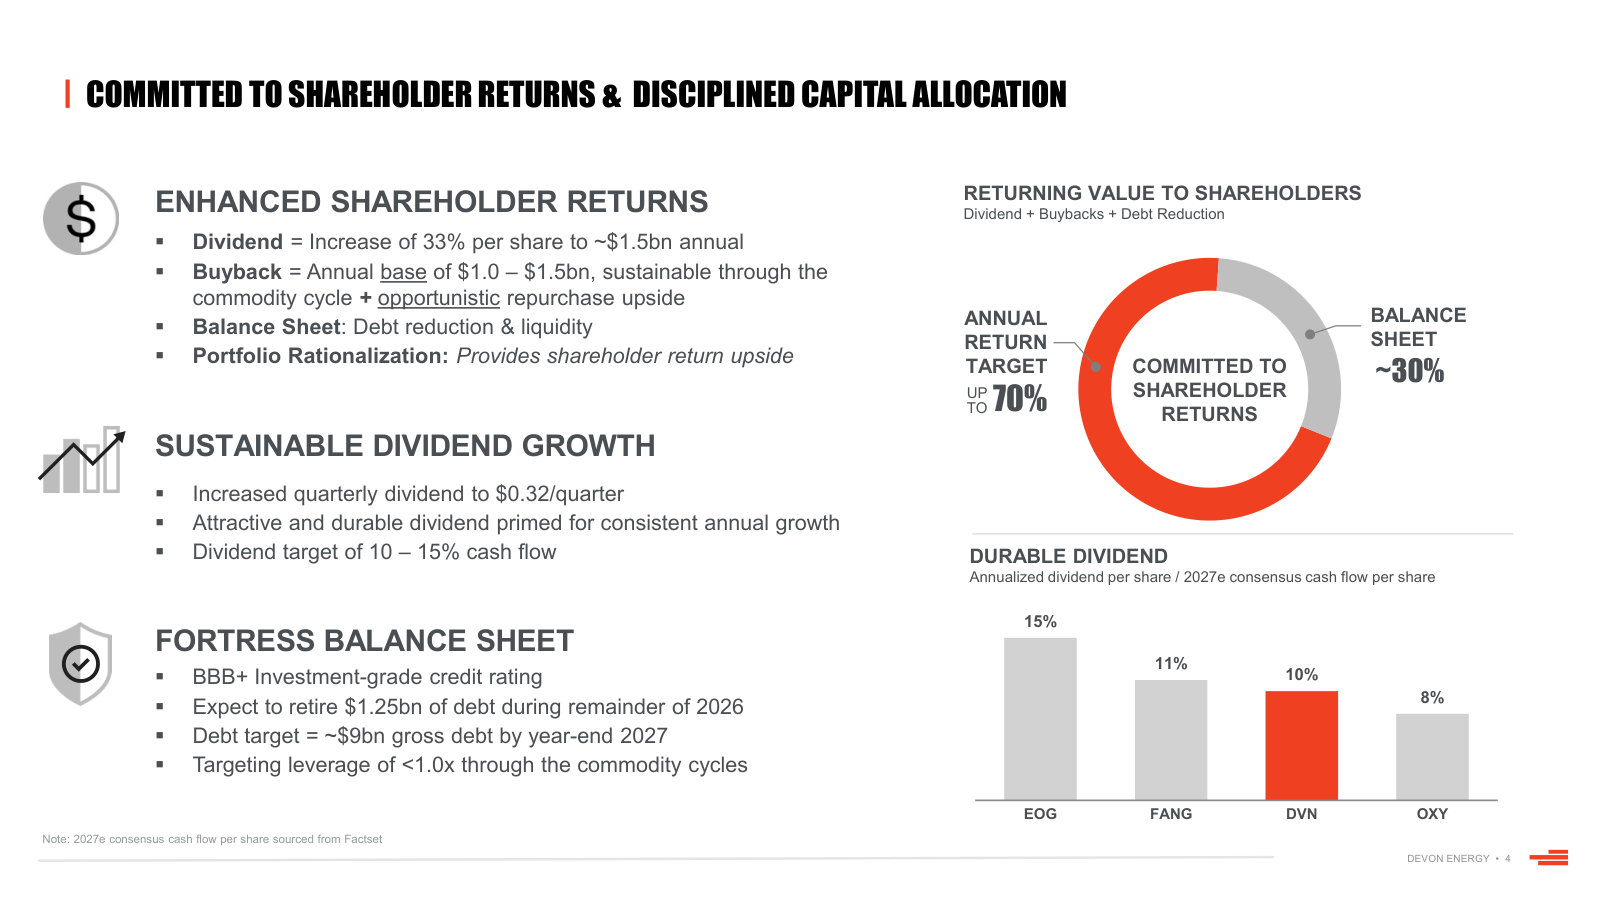
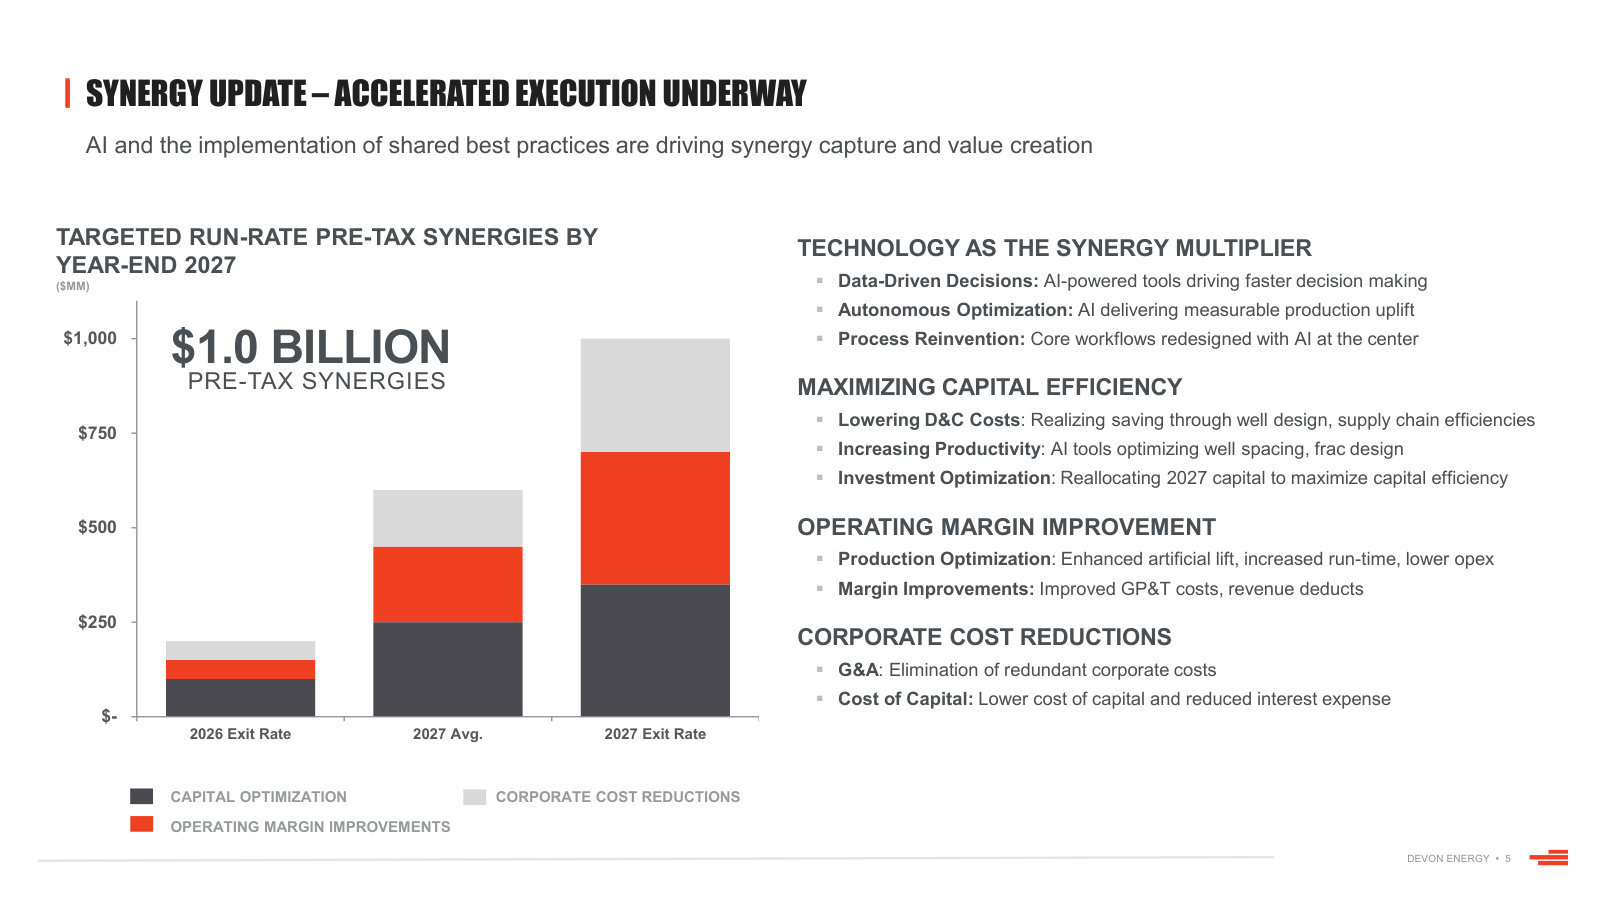
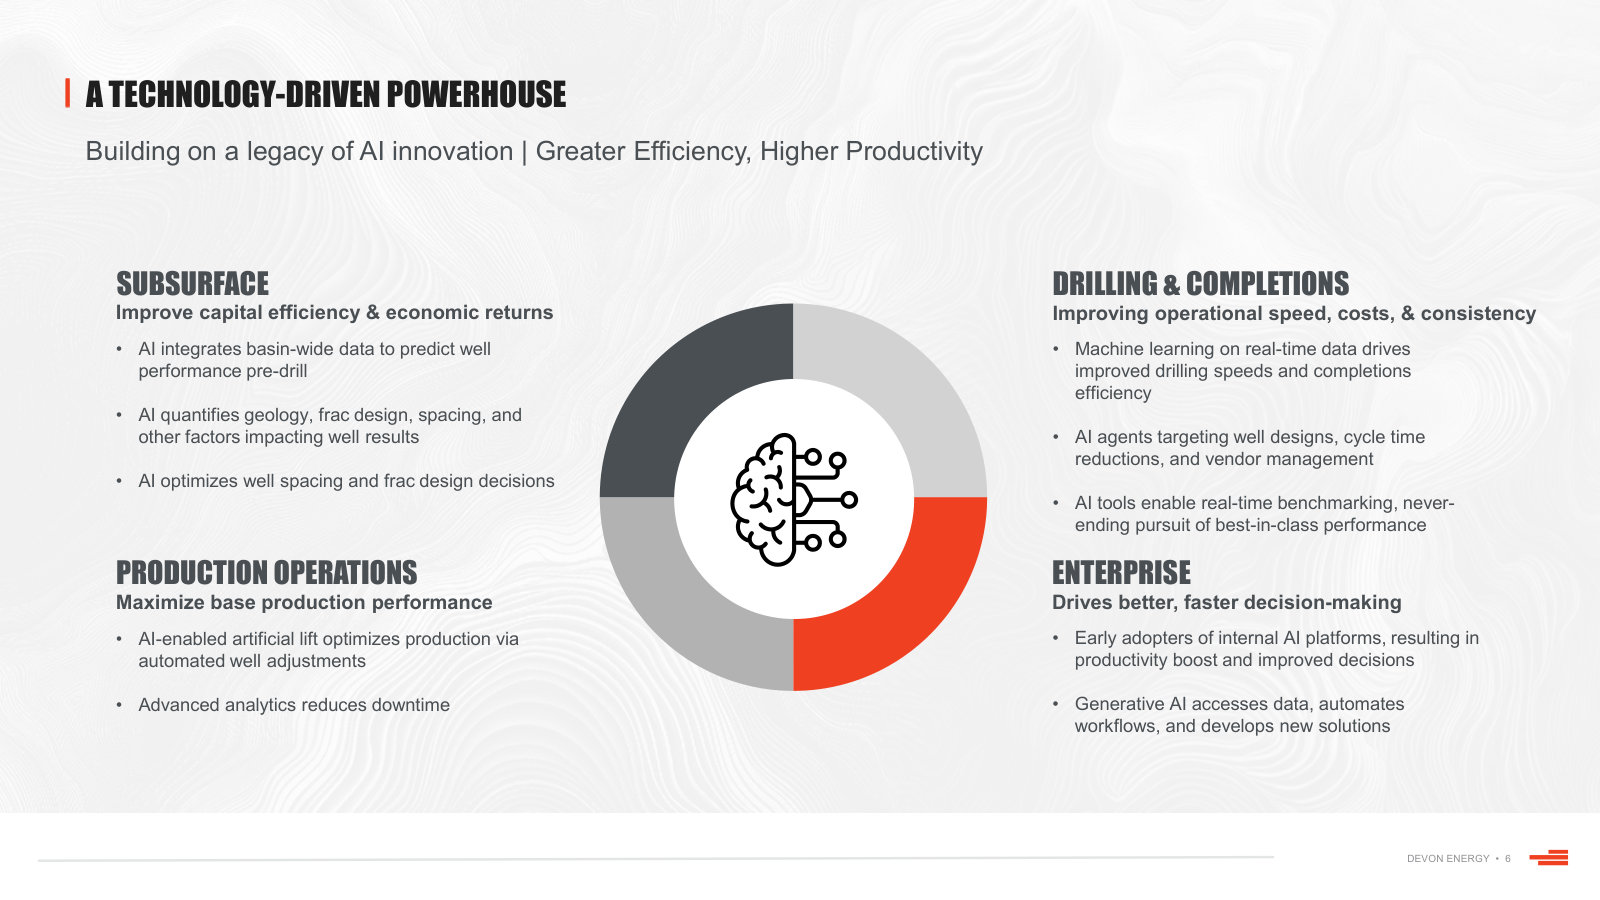
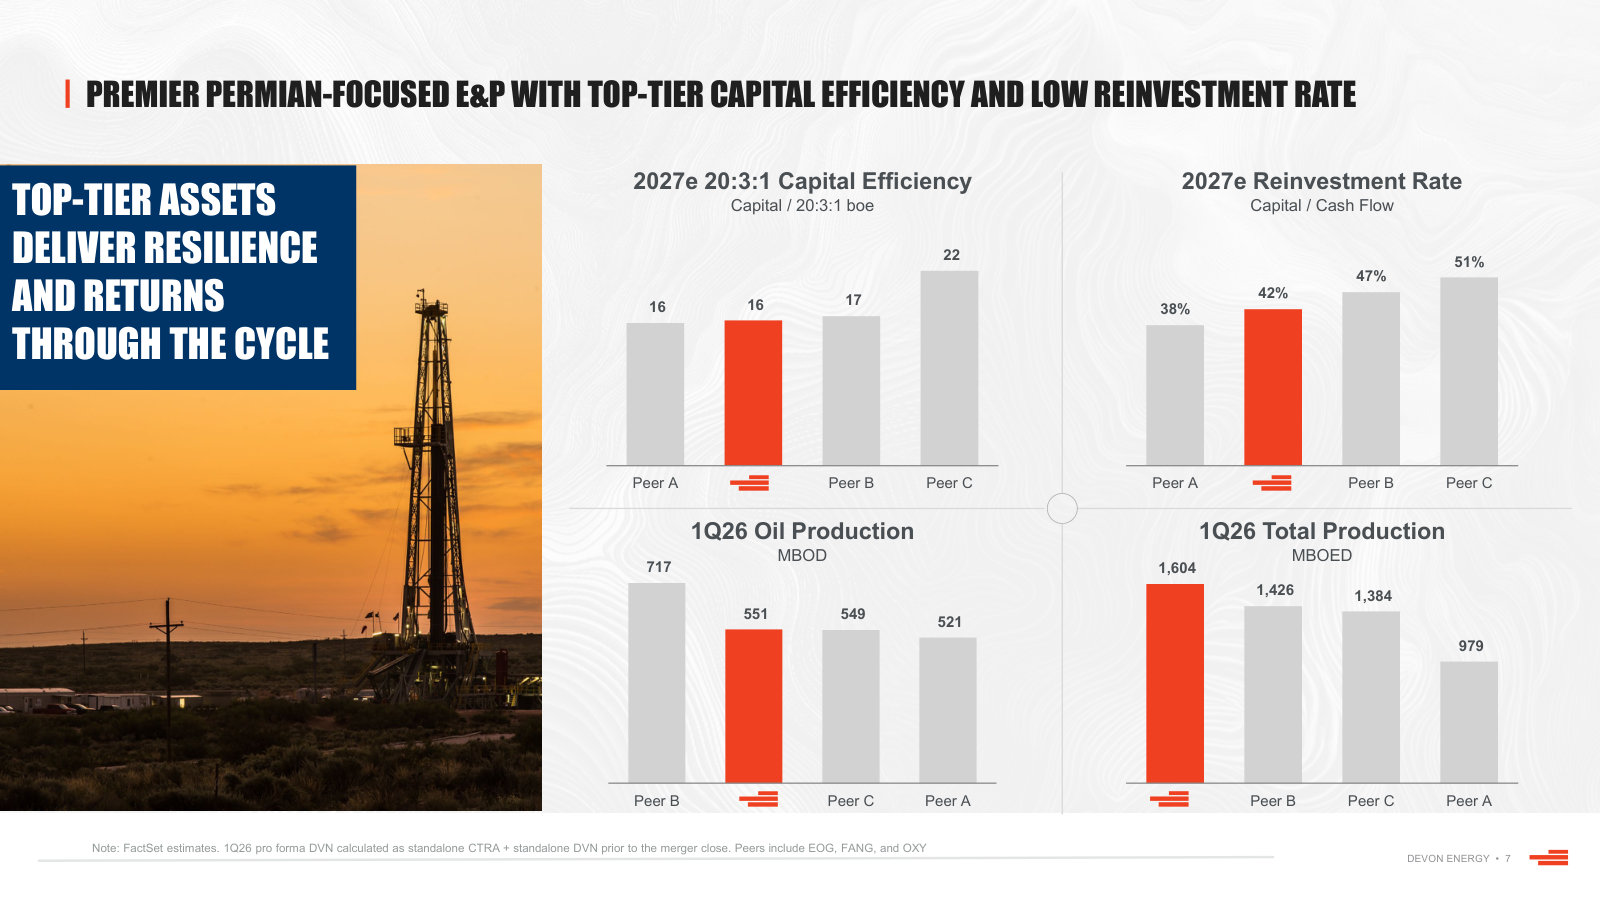
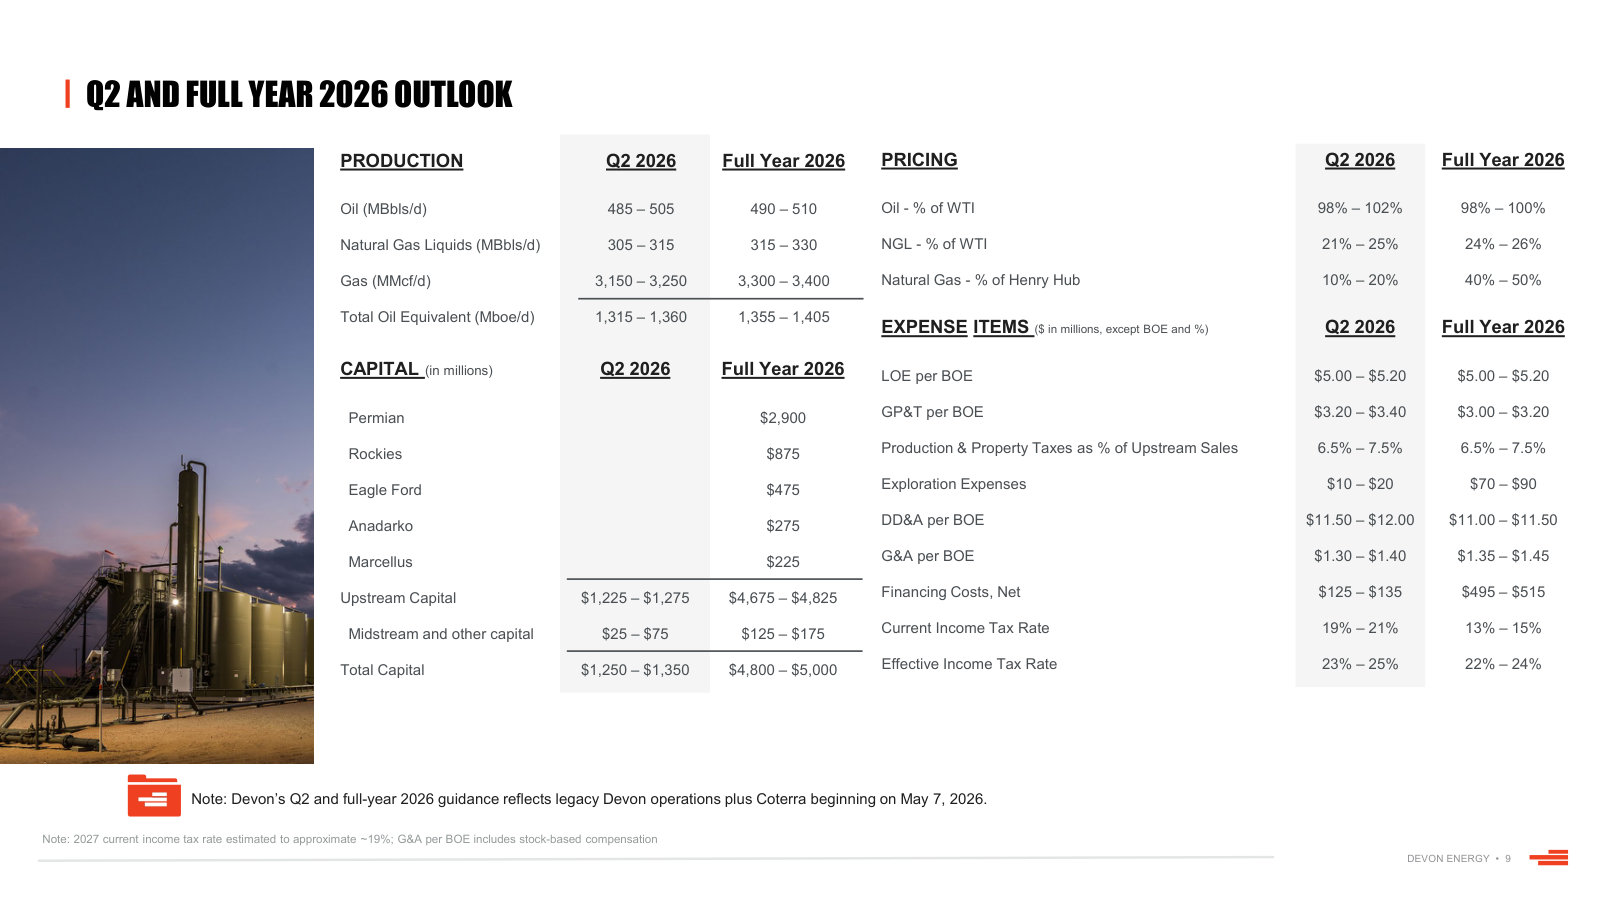
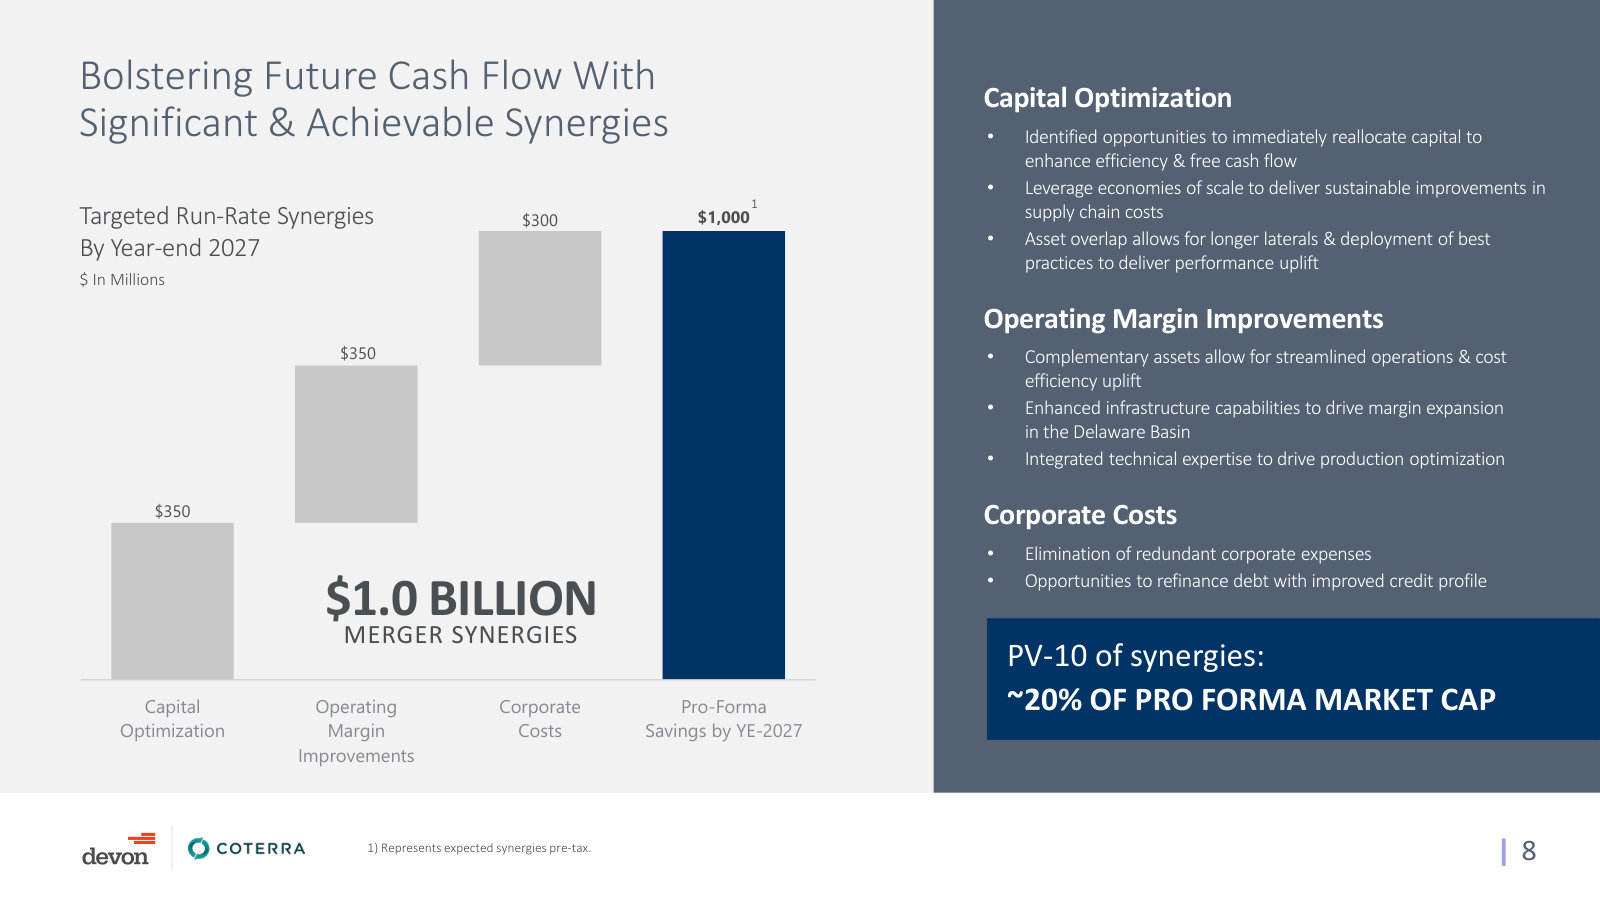
p. 2 — The CEO's own framing of the four current priorities: portfolio review, early actions, Permian weighting and AI deployment. · Open the full presentation →p. 3 — 2026 guidance for the combined company — 490-510 MBOD oil, 1.36-1.41 MMBOED total, $4.9bn capital, over 90% oil-weighted. · Open the full presentation →p. 4 — The capital allocation formula: up to 70% of cash returned, ~30% to the balance sheet, $0.32 quarterly dividend, $9bn debt target. · Open the full presentation →p. 5 — Where the $1.0bn of merger synergies comes from and when it lands — capital, operating margin and corporate cost, by 2027 exit rate. · Open the full presentation →p. 6 — How AI is applied across subsurface, production, drilling and enterprise — the company's stated efficiency engine. · Open the full presentation →p. 7 — Capital efficiency, reinvestment rate and production against EOG, FANG and OXY — the peer comparison management invites. · Open the full presentation →p. 9 — Full guidance table, including the 2026 capital split by basin: Permian $2.9bn against Rockies, Eagle Ford, Anadarko and Marcellus. · Open the full presentation →
The last standalone-Devon quarter, and the clearest account of the $1bn business optimization program and the asset-level deals around it. · Open the full document →
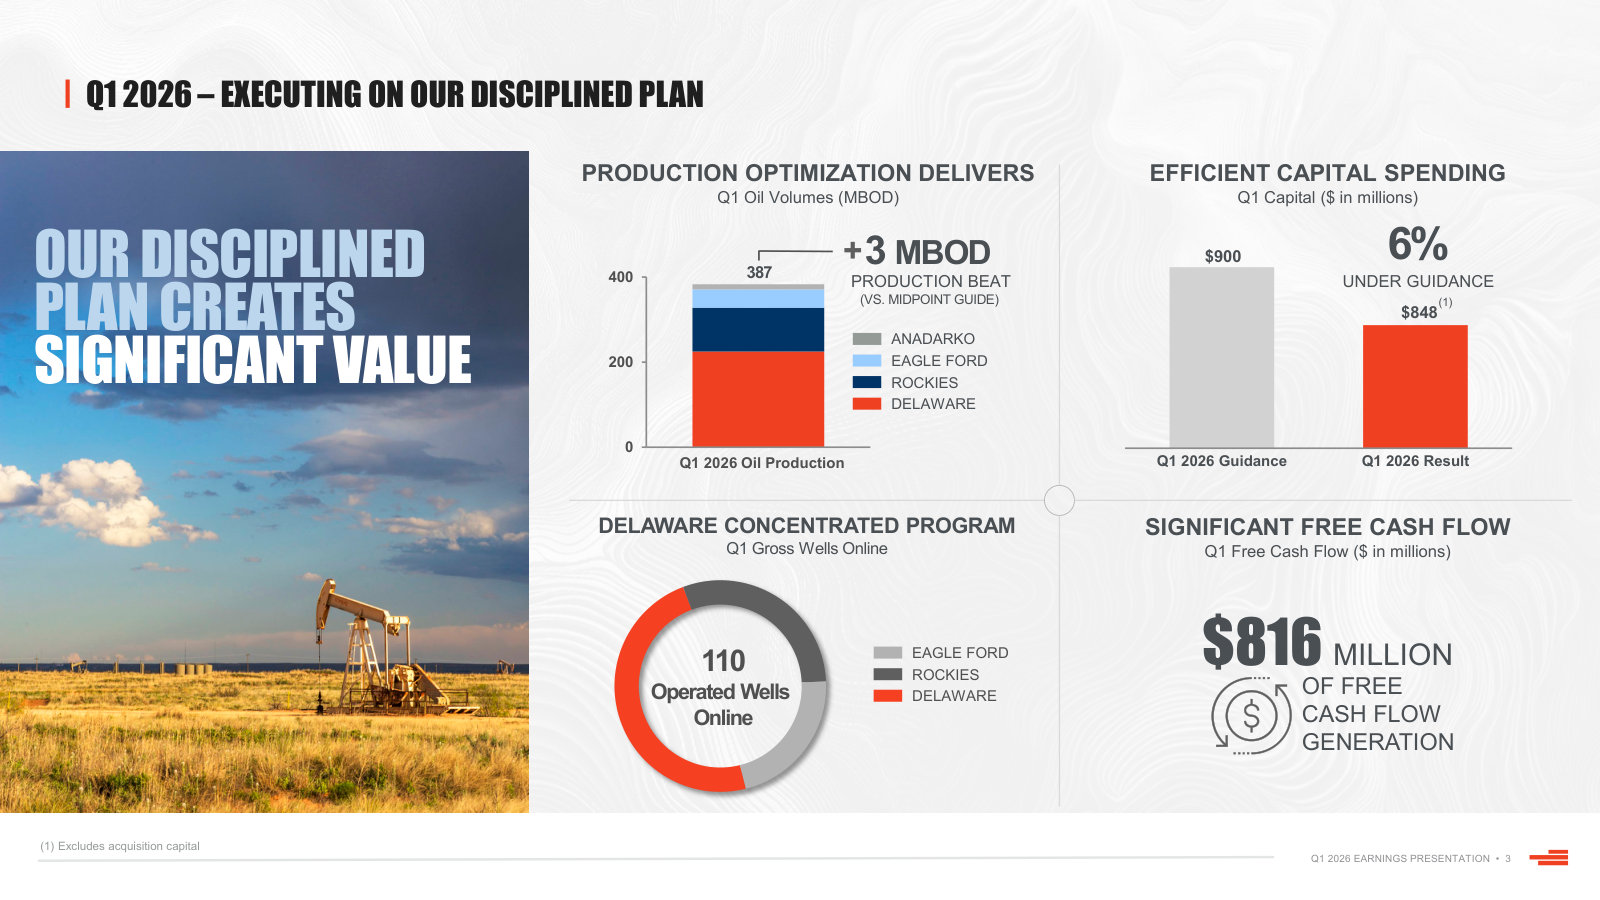
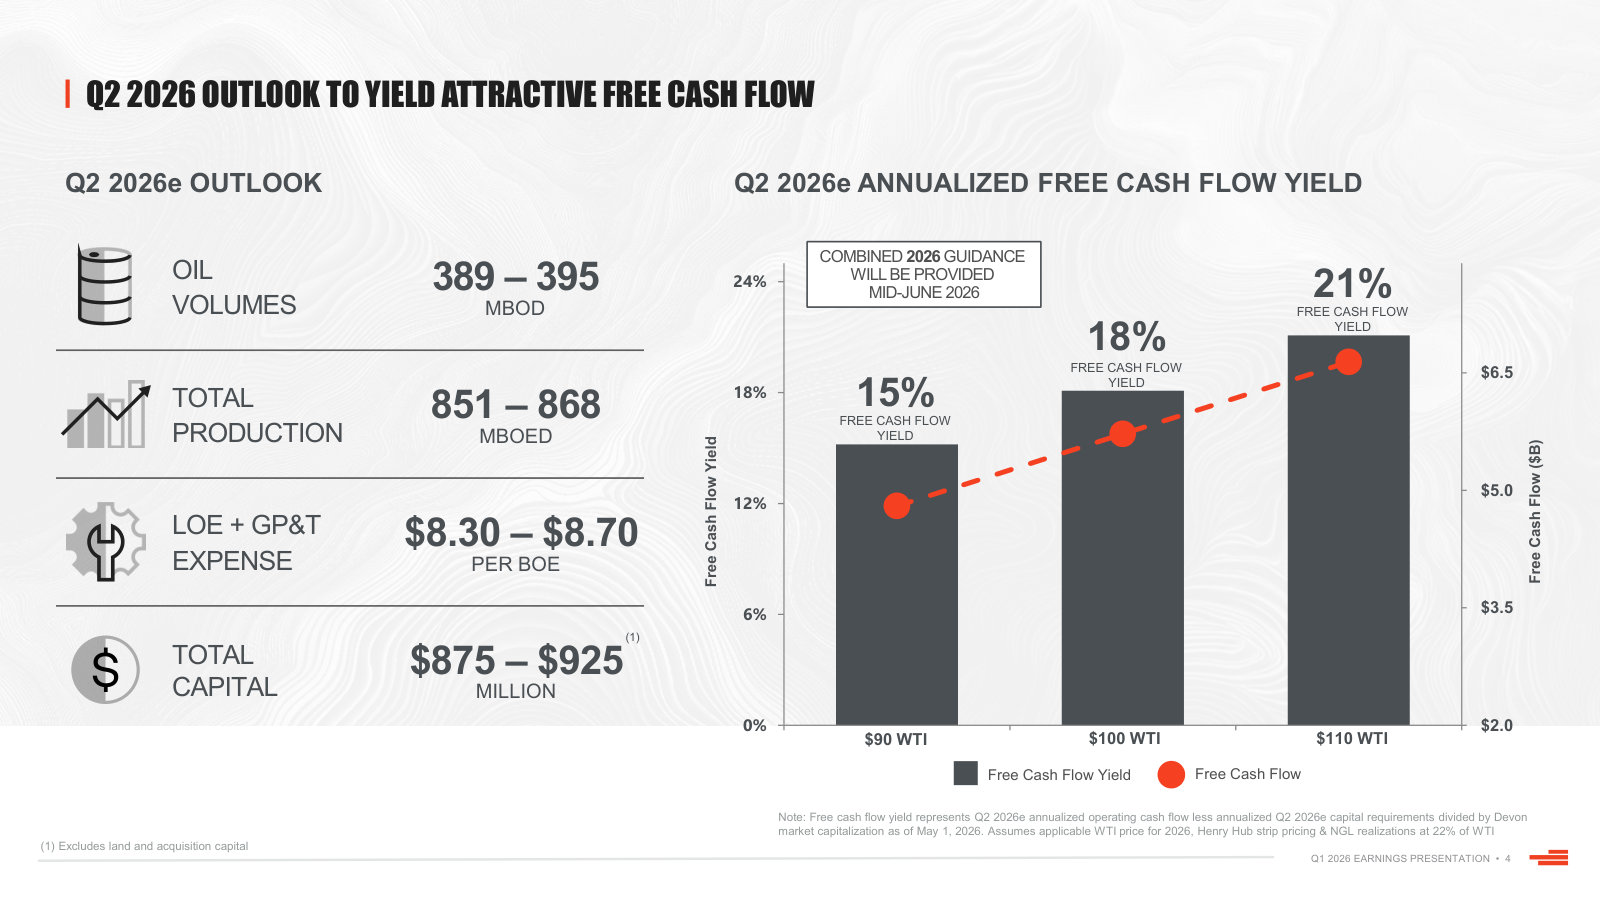
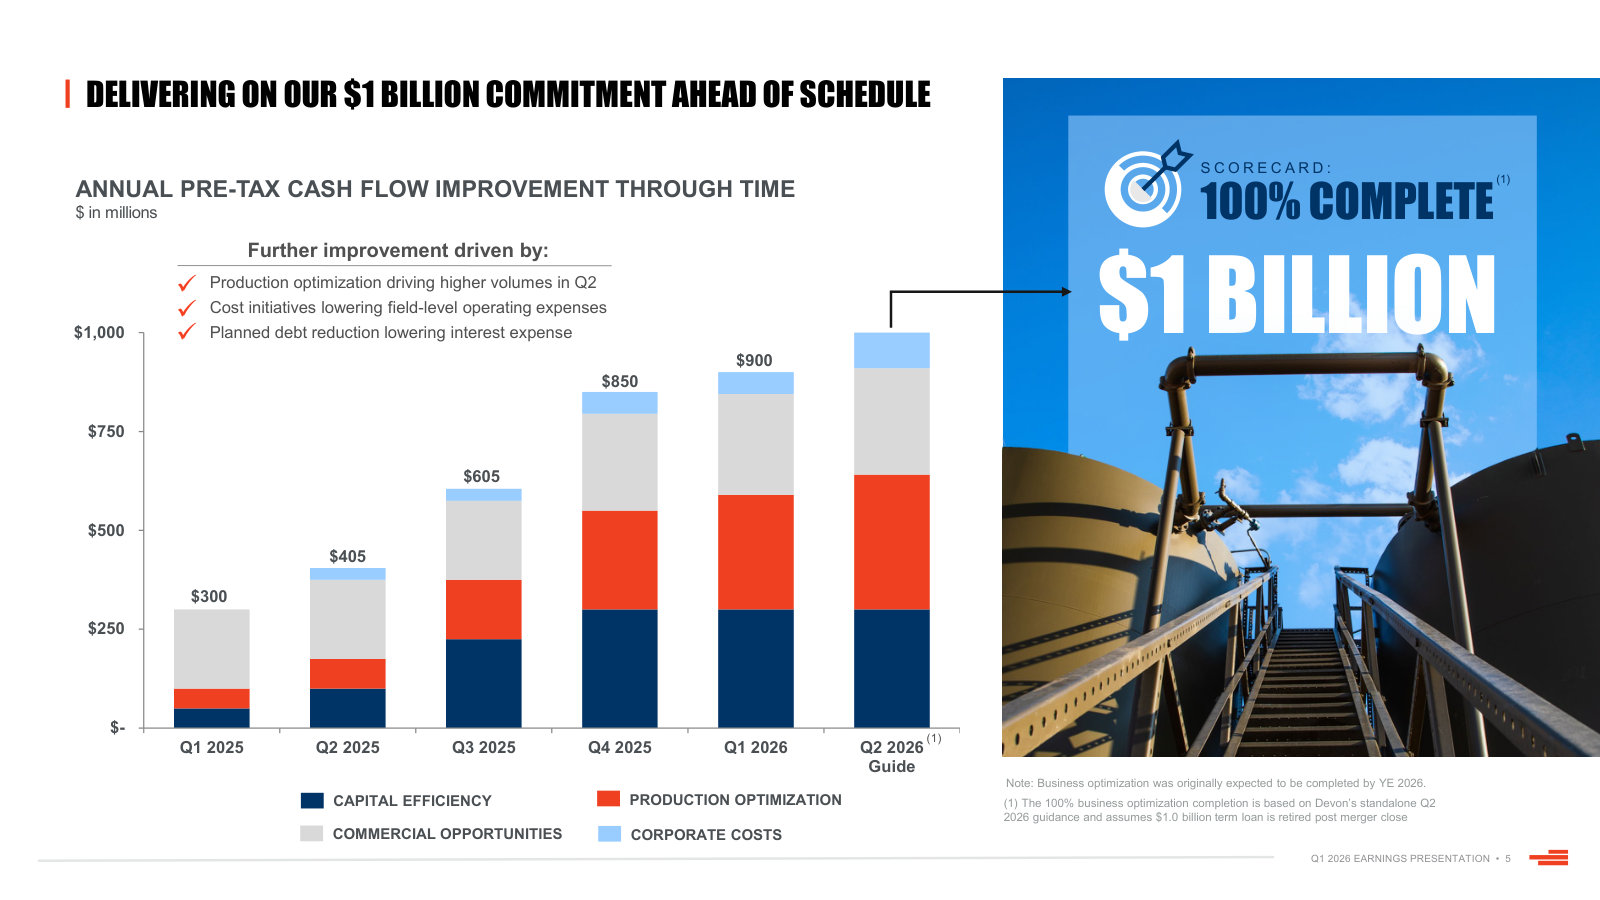
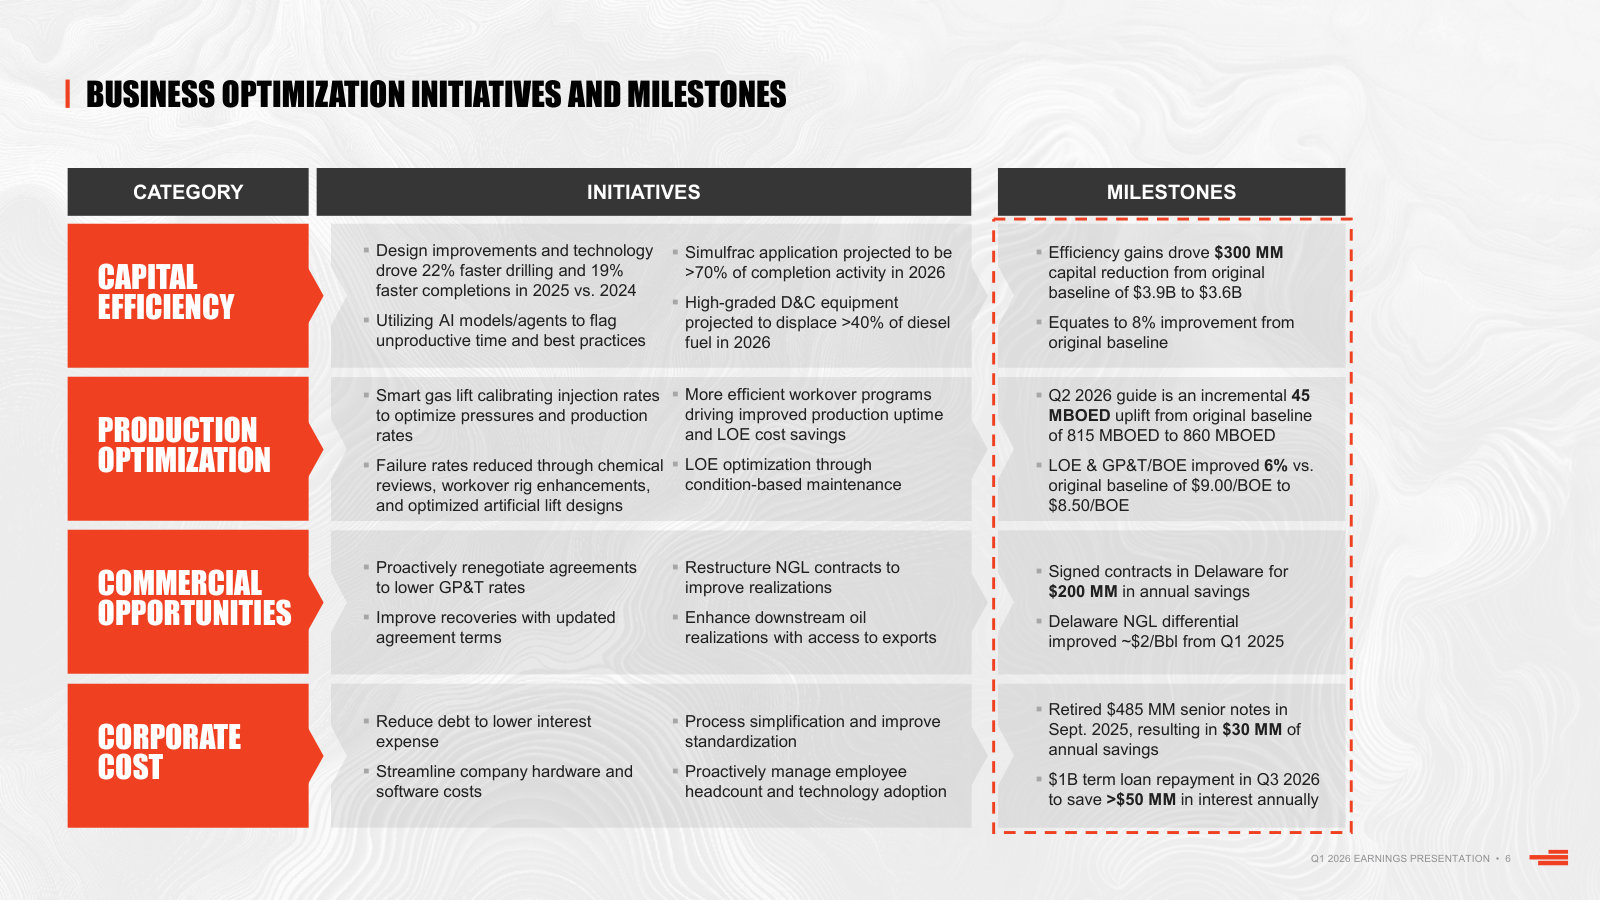
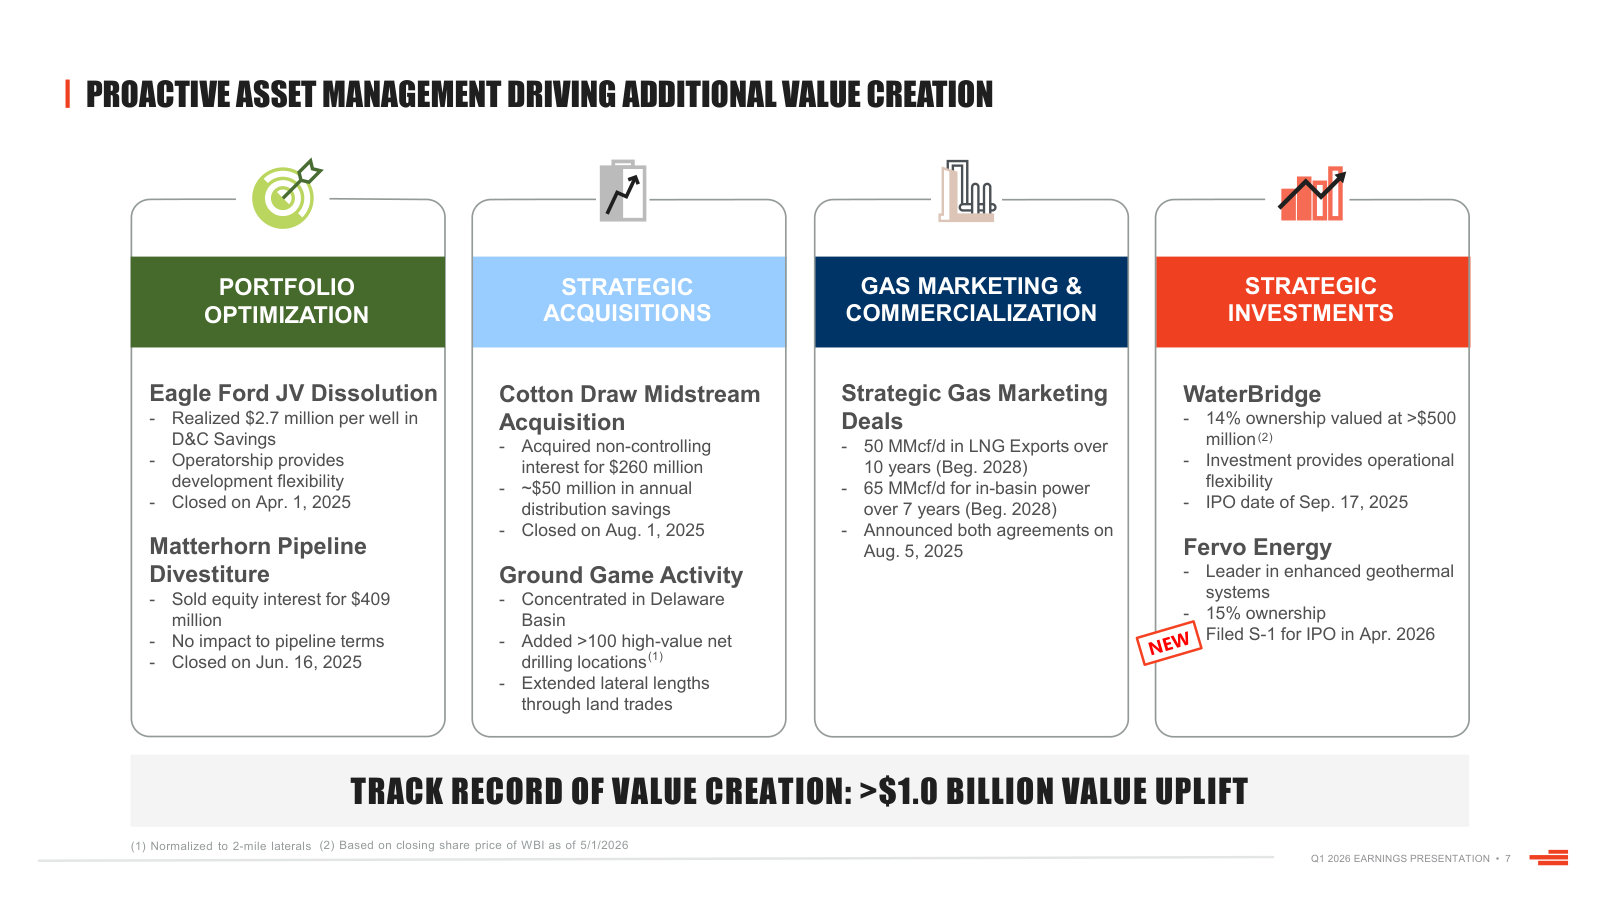
p. 3 — A quarter in four numbers, with oil volumes broken out by basin — Delaware dominates both production and the well program. · Open the full presentation →p. 4 — Free cash flow yield at $90, $100 and $110 WTI — how much the equity's cash generation swings with the oil price. · Open the full presentation →p. 5 — The $1bn business optimization program quarter by quarter from launch to completion, split by source of improvement. · Open the full presentation →p. 6 — The initiative-level detail behind that $1bn: drilling speed, artificial lift, GP&T renegotiation, debt retirement, with milestones. · Open the full presentation →p. 7 — The non-drilling levers — Eagle Ford JV dissolution, Matterhorn sale, Cotton Draw purchase, and the WaterBridge and Fervo stakes. · Open the full presentation →
The deal deck that defines today's company — pro forma scale, basin-by-basin footprint, inventory depth and the synergy case. · Open the full document →
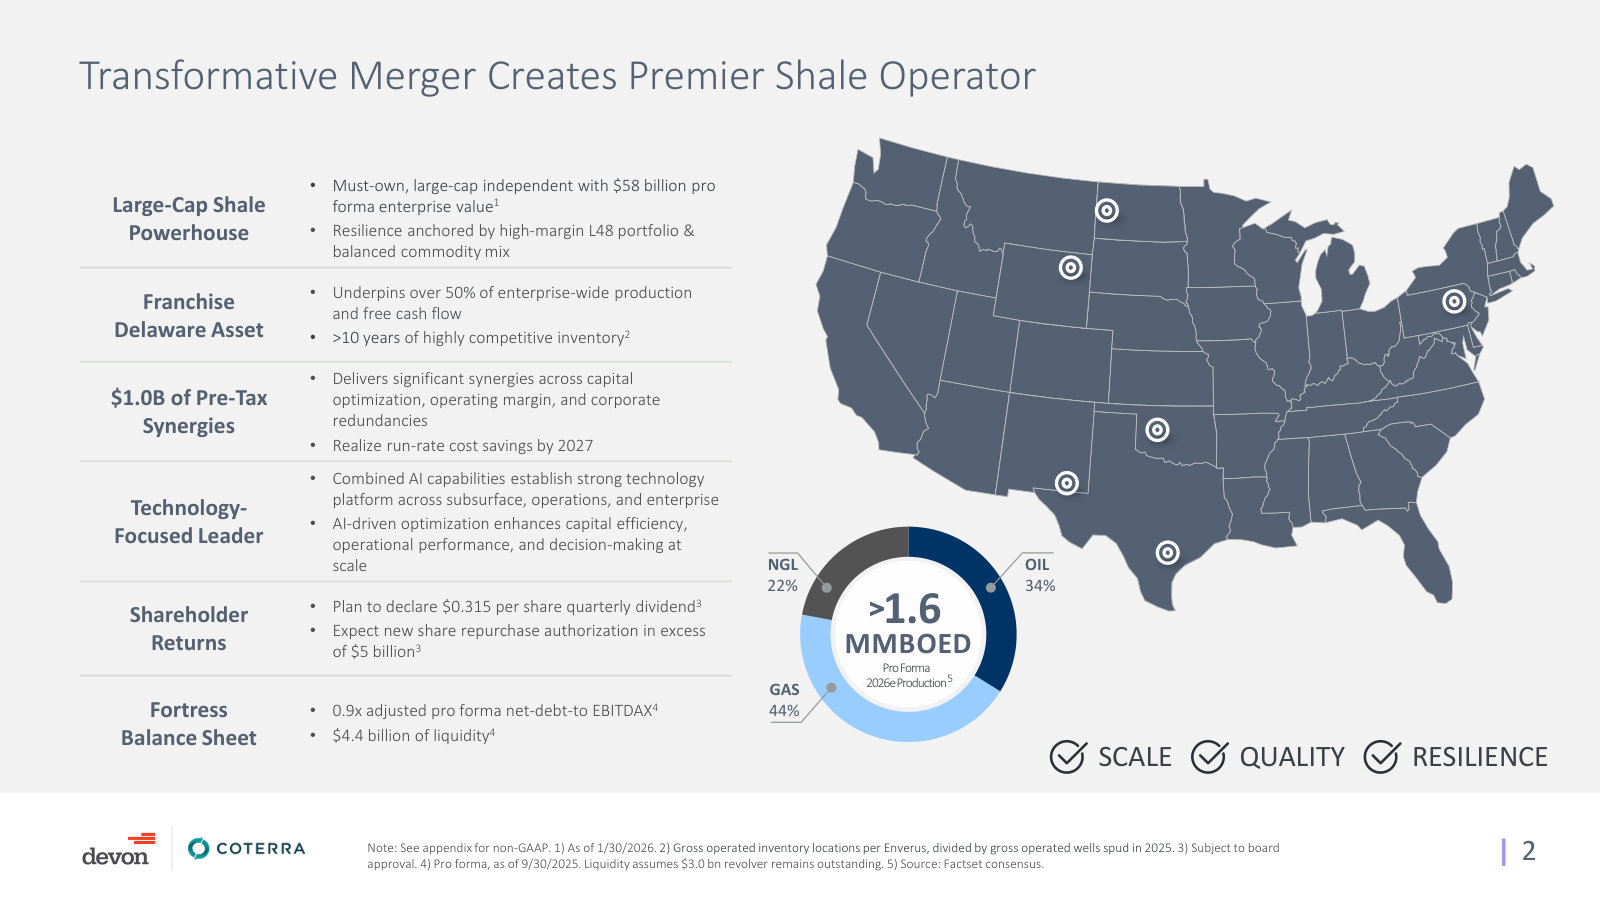
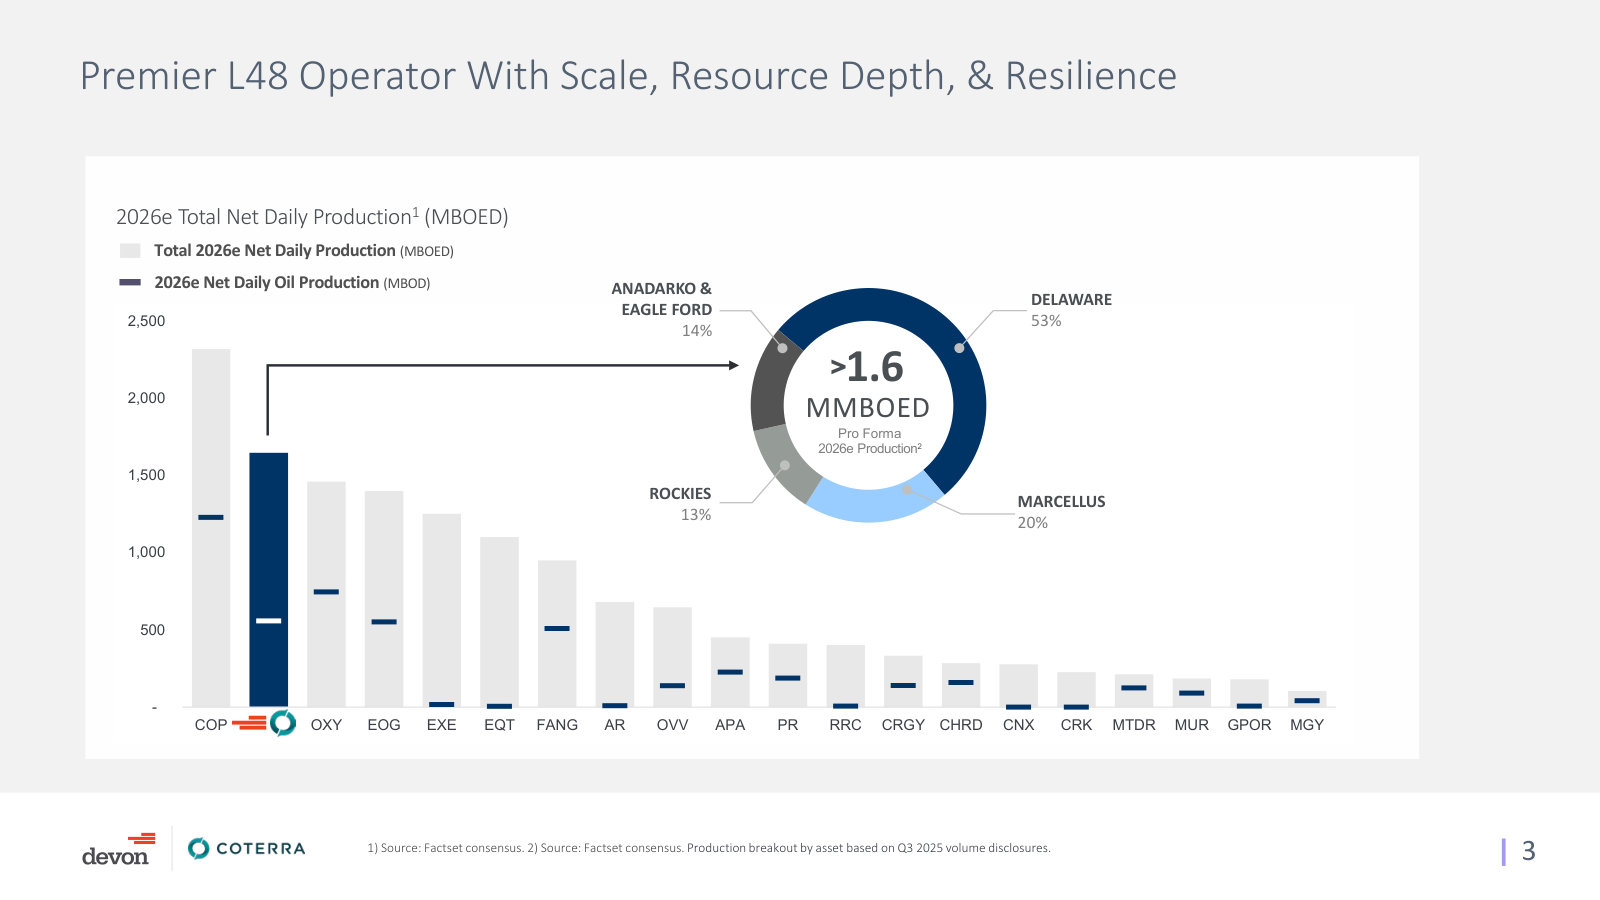
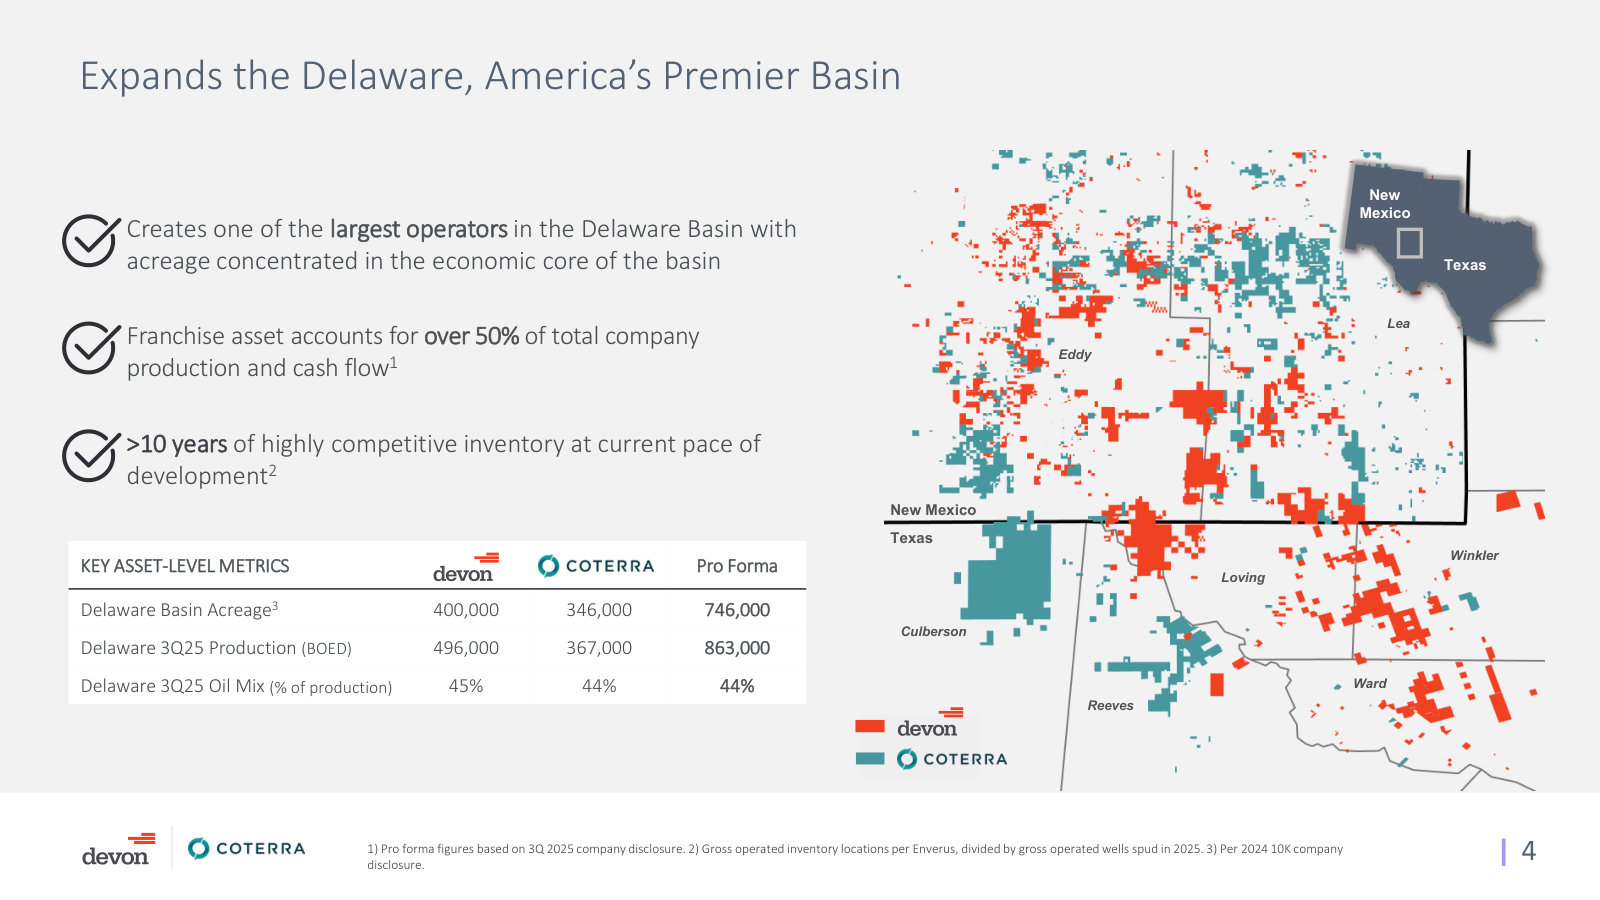
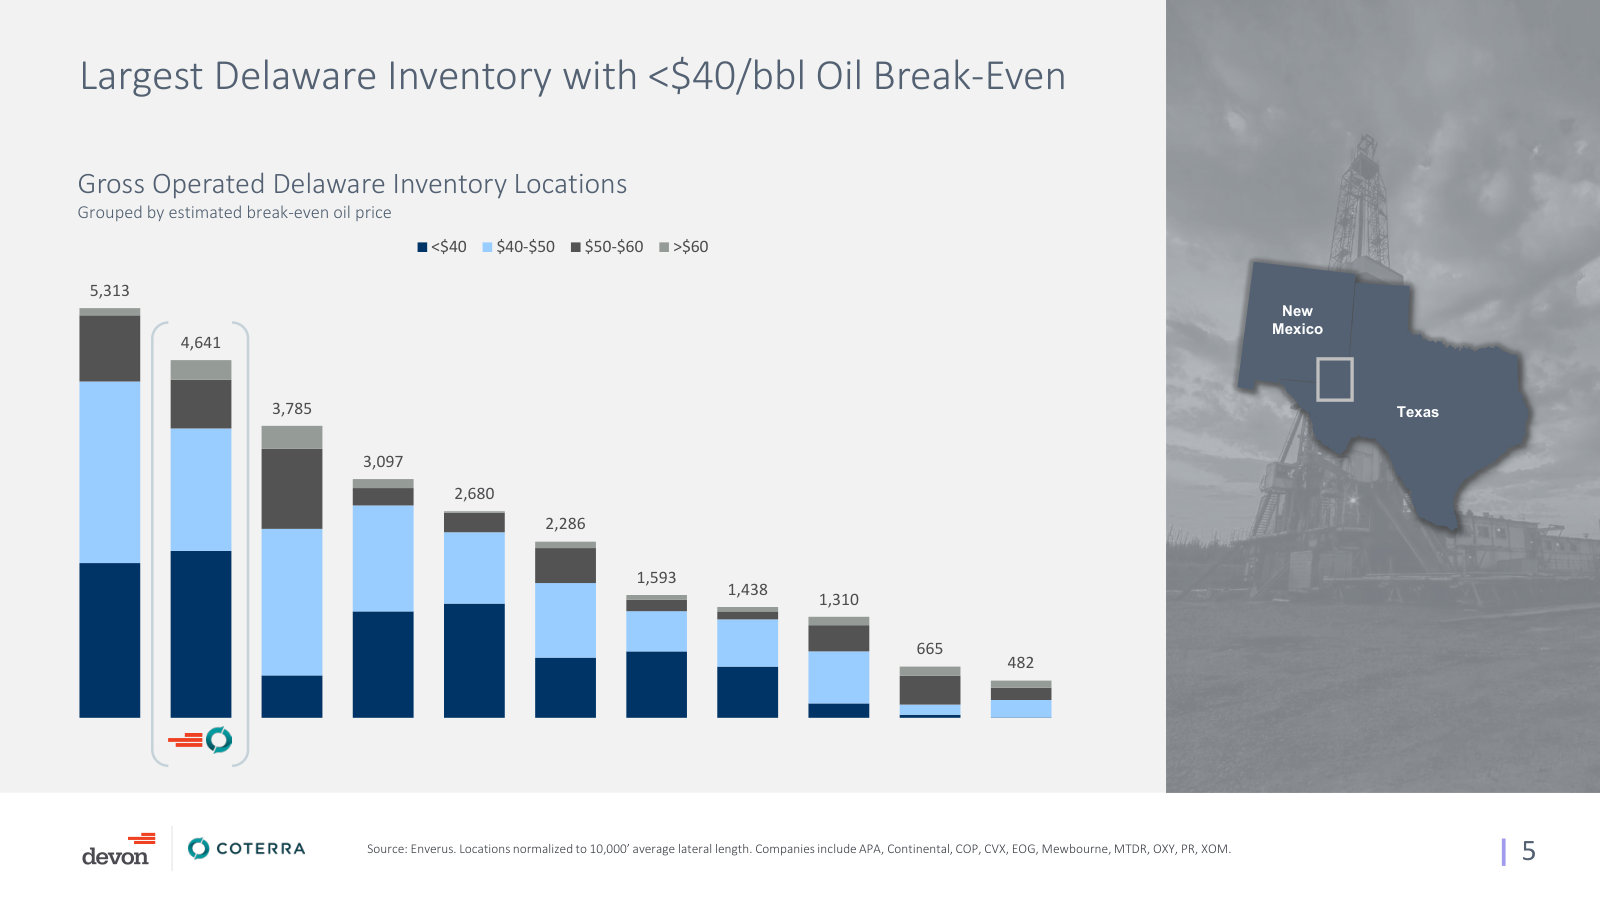
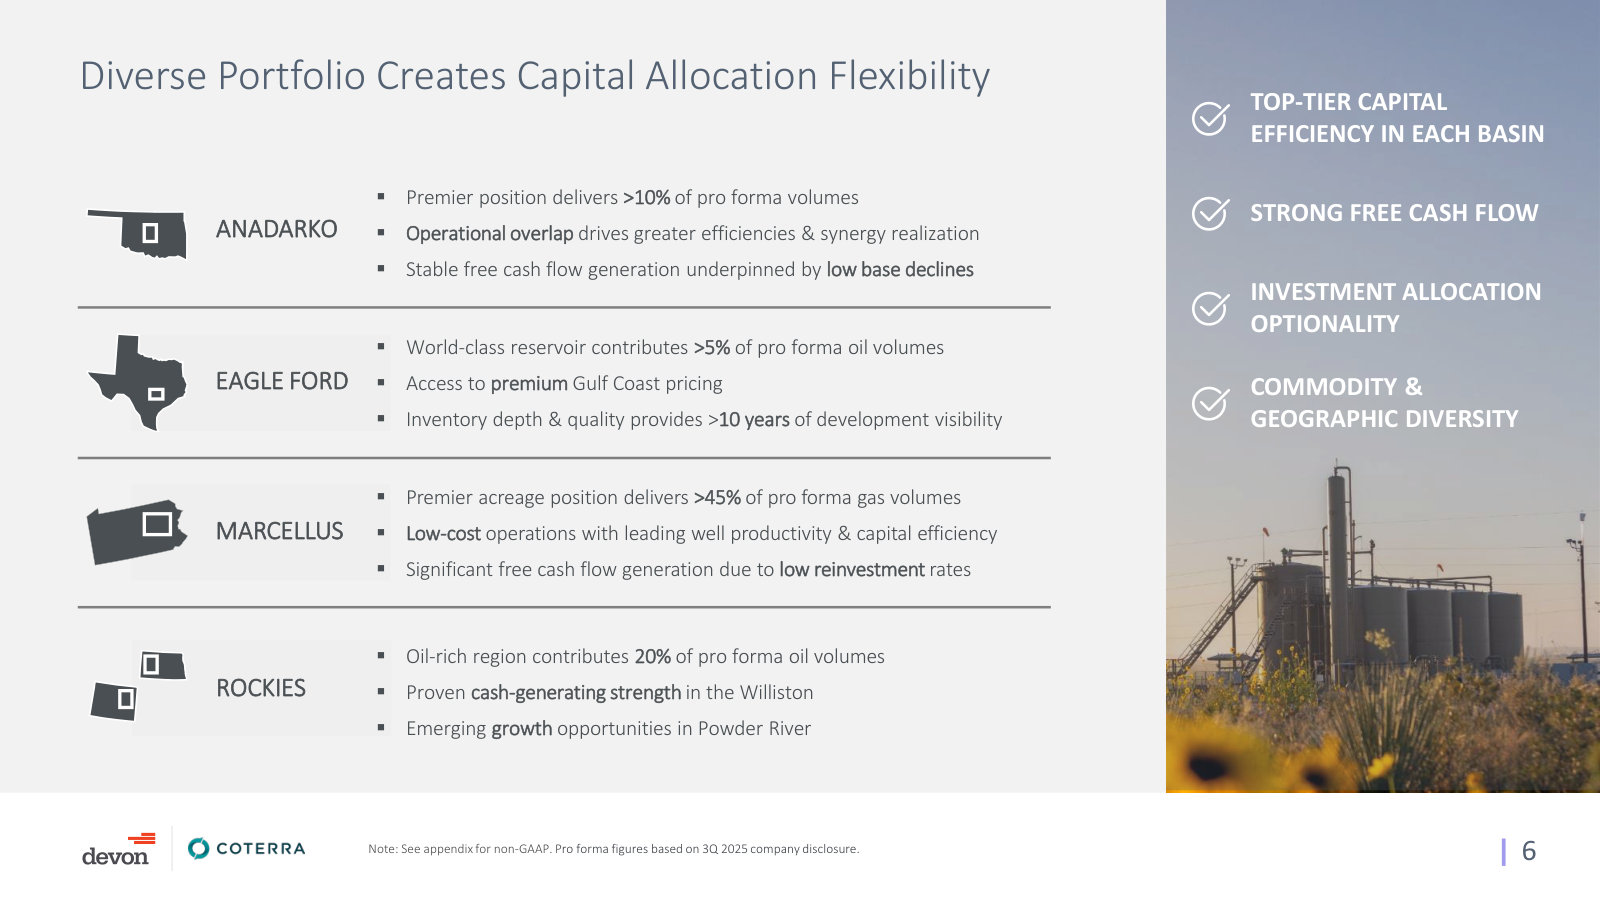
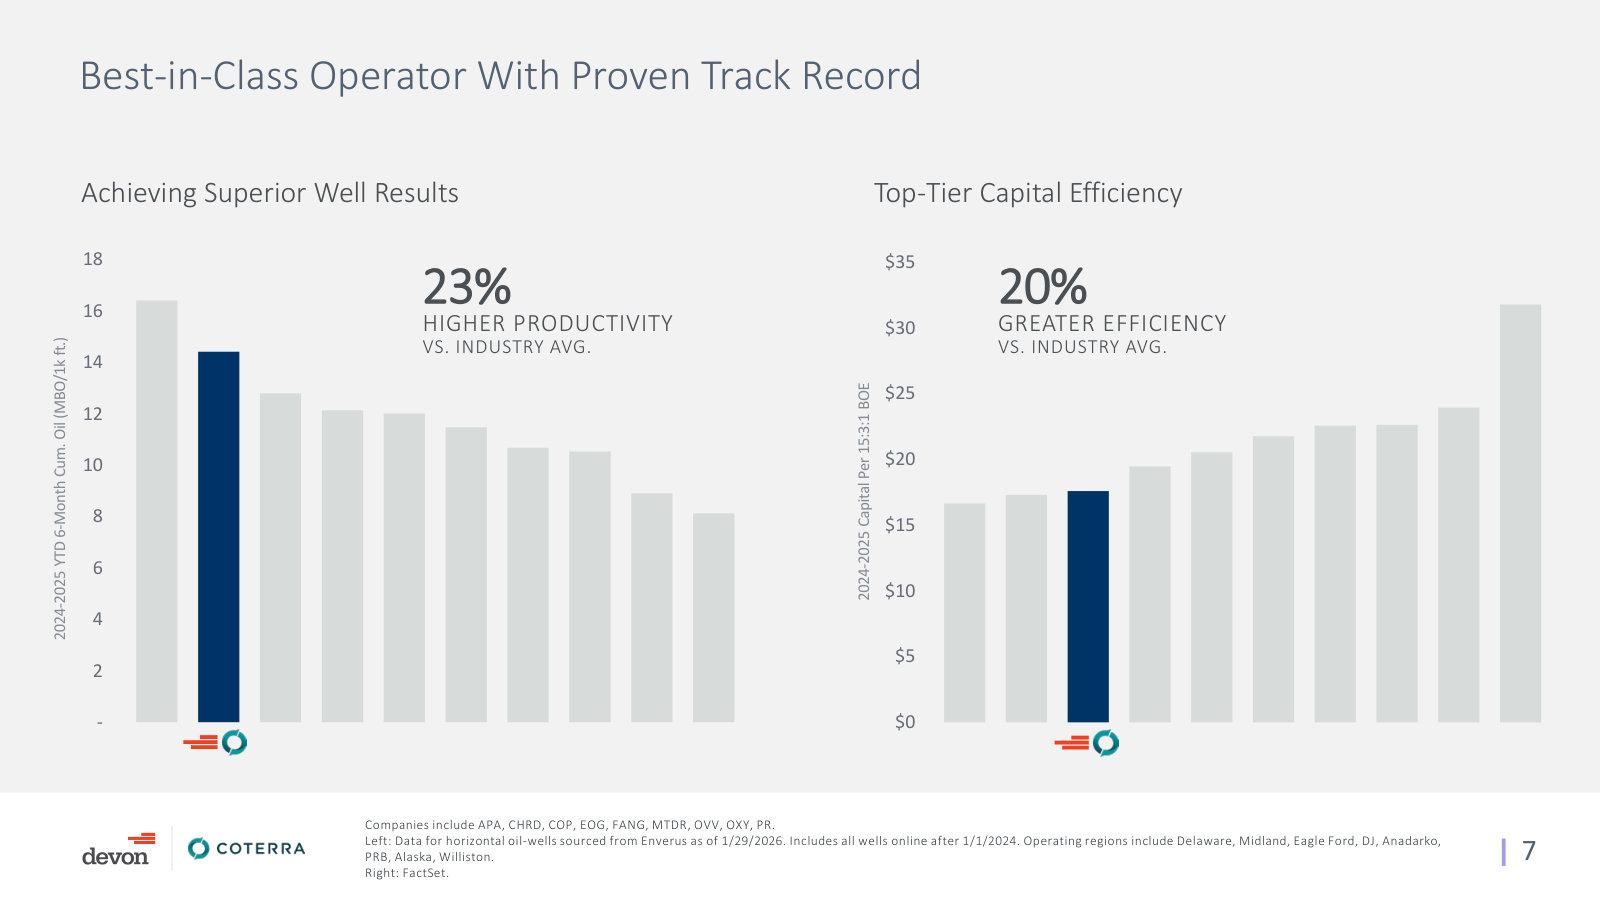
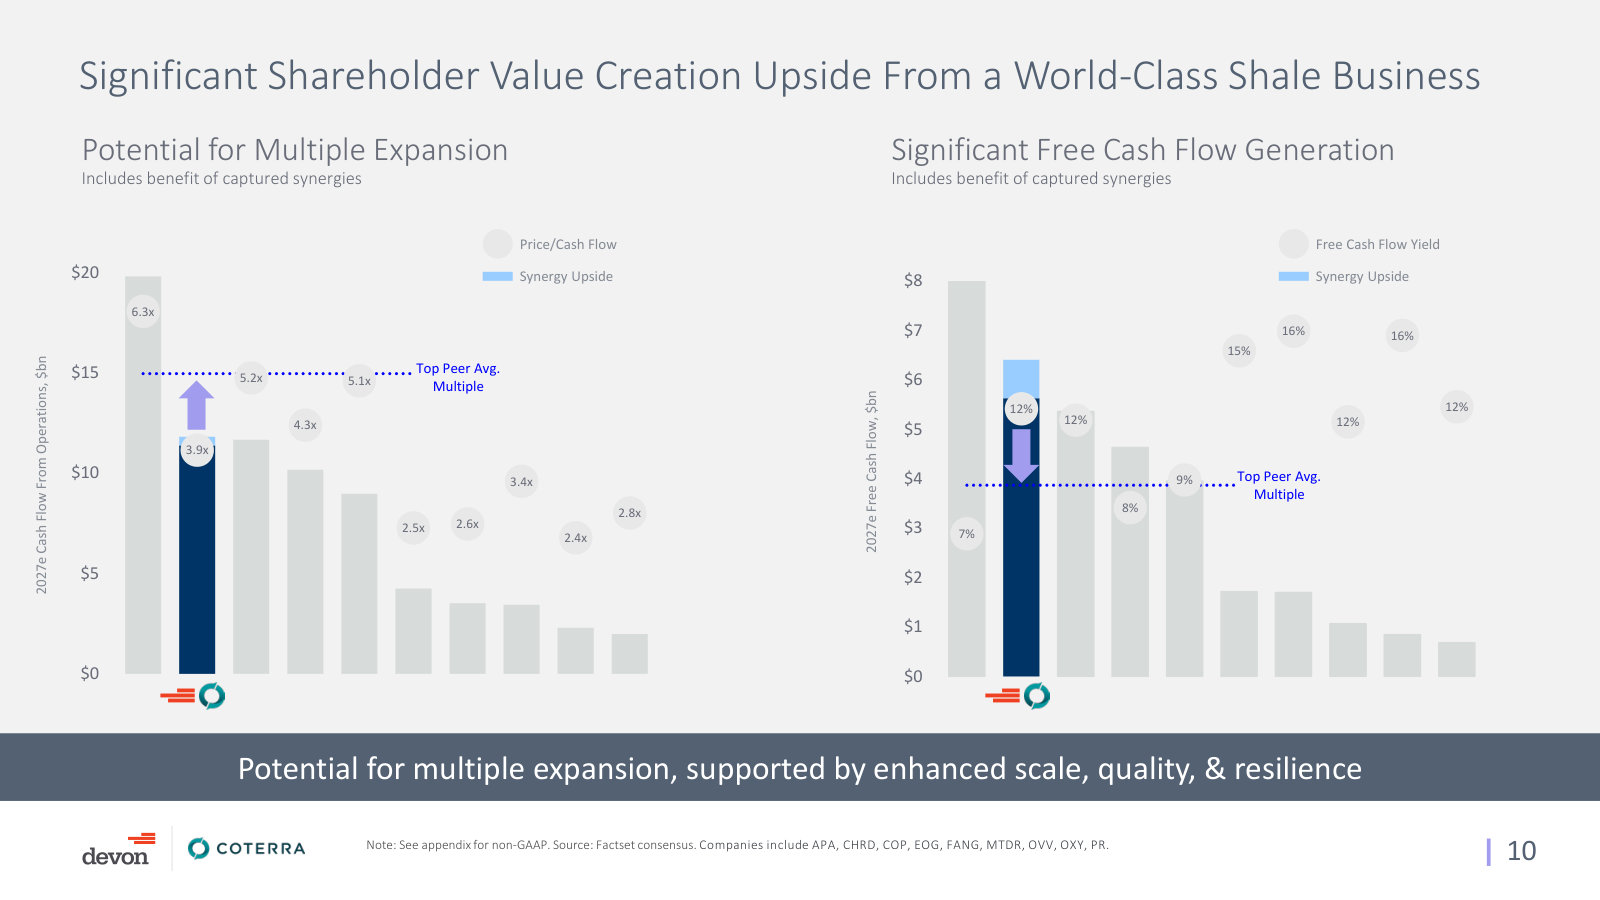
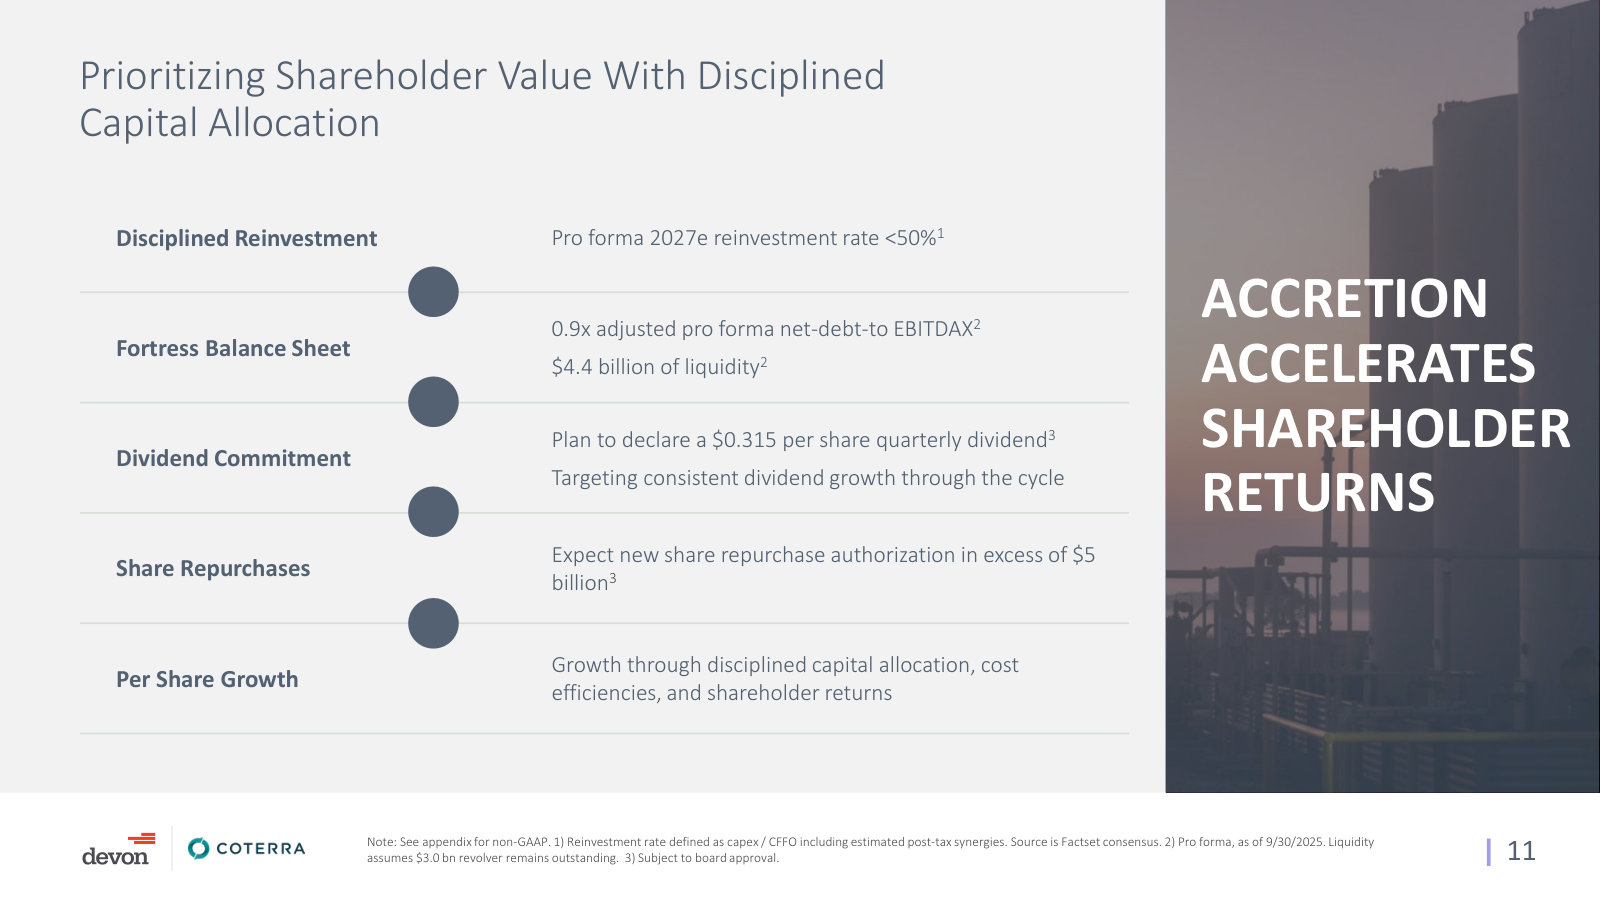
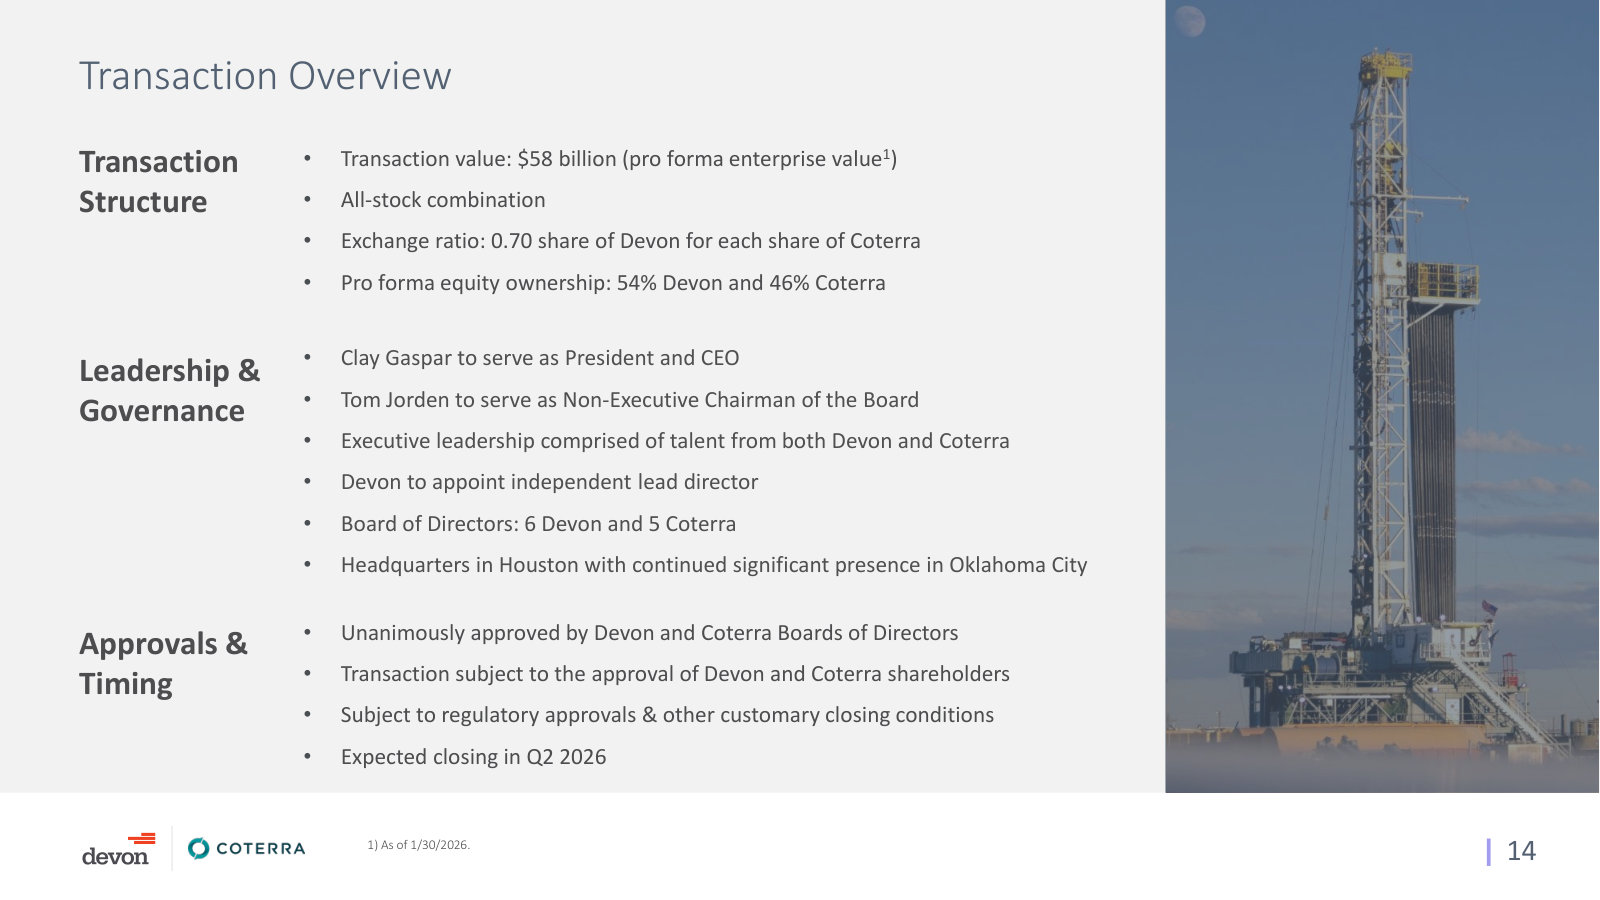
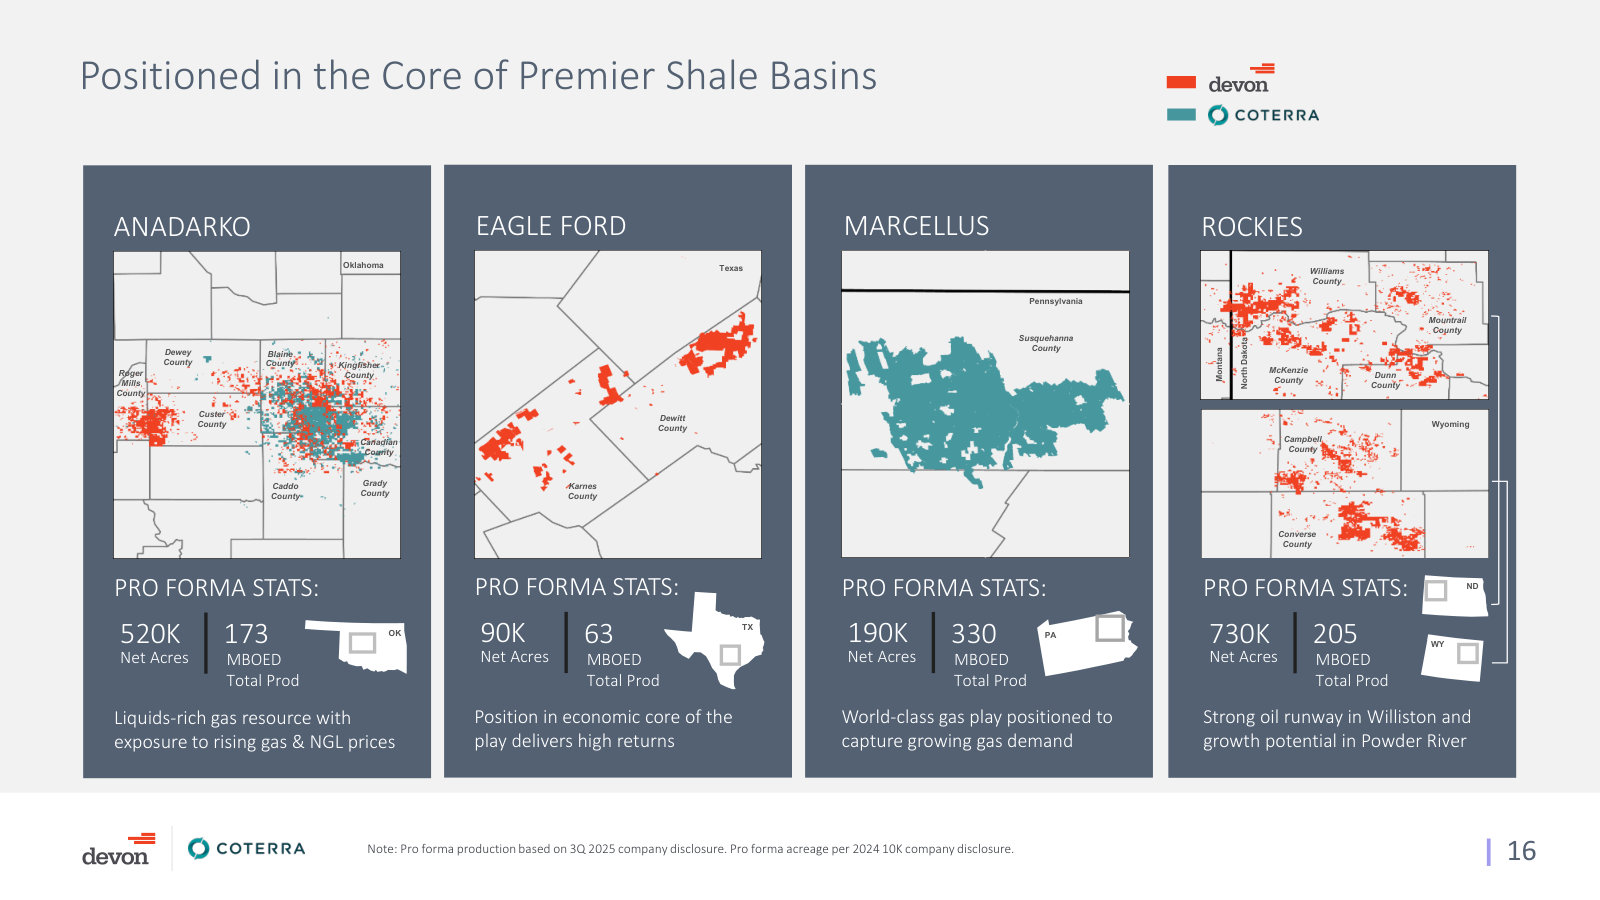
p. 2 — The combined company on one page: ~$58bn enterprise value, >1.6 MMBOED, and a 34/22/44 oil-NGL-gas mix across five basins. · Open the full presentation →p. 3 — Pro forma production against every large-cap L48 peer, with the split by basin — Delaware 53%, Marcellus 20%, Rockies 13%. · Open the full presentation →p. 4 — The two Delaware acreage positions overlaid: 746,000 net acres and 863 MBOED, over half of company production and cash flow. · Open the full presentation →p. 5 — Delaware inventory by operator, grouped by break-even oil price — the depth-of-sub-$40 argument against the rest of the basin. · Open the full presentation →p. 6 — What the four non-Delaware basins each contribute, and why management calls the mix capital-allocation optionality. · Open the full presentation →p. 7 — Well productivity and capital per BOE against nine named peers — the operational claim underpinning the merger. · Open the full presentation →p. 8 — The $1.0bn synergy bridge, split into capital, operating margin and corporate cost, with a PV-10 worth ~20% of market cap. · Open the full presentation →p. 10 — Cash-flow multiple and free cash flow yield versus peers — the re-rating case management is asking to be judged on. · Open the full presentation →p. 11 — Post-close capital allocation policy: sub-50% reinvestment, 0.9x leverage, $0.315 dividend, >$5bn buyback authorization. · Open the full presentation →p. 14 — Deal mechanics: all-stock, 0.70 exchange ratio, 54/46 ownership, board split, and the move of headquarters to Houston. · Open the full presentation →p. 16 — Acreage maps and pro forma stats for Anadarko, Eagle Ford, Marcellus and the Rockies — the non-Permian half of the company. · Open the full presentation →
The last full company-overview deck before the merger, and still the only asset-by-asset walkthrough of the legacy Devon basins. · Open the full document →
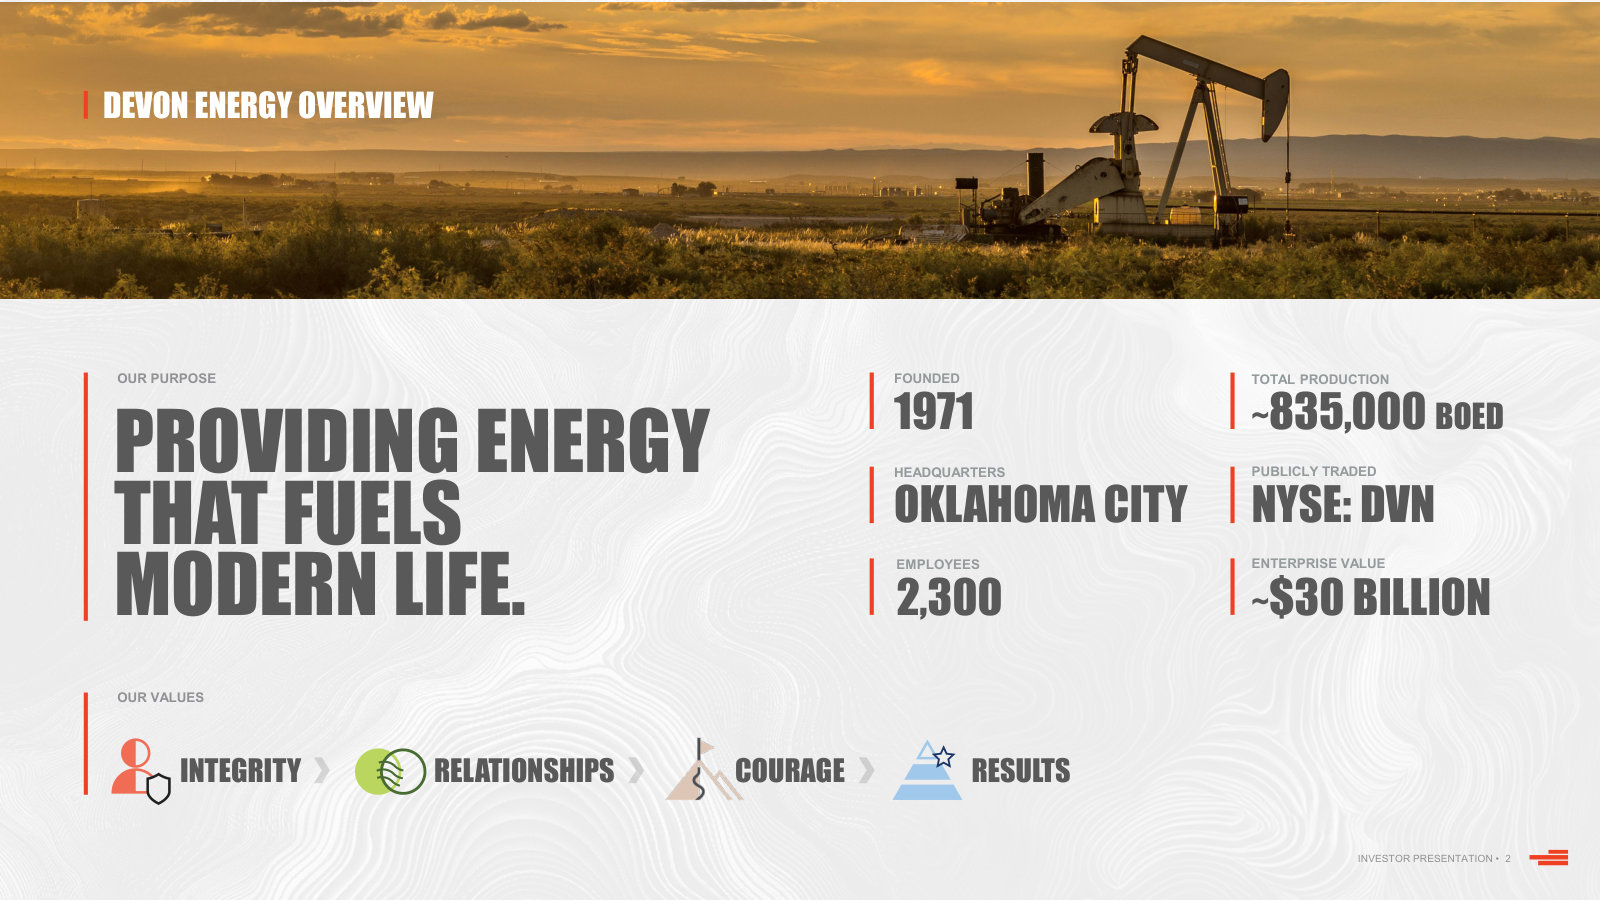
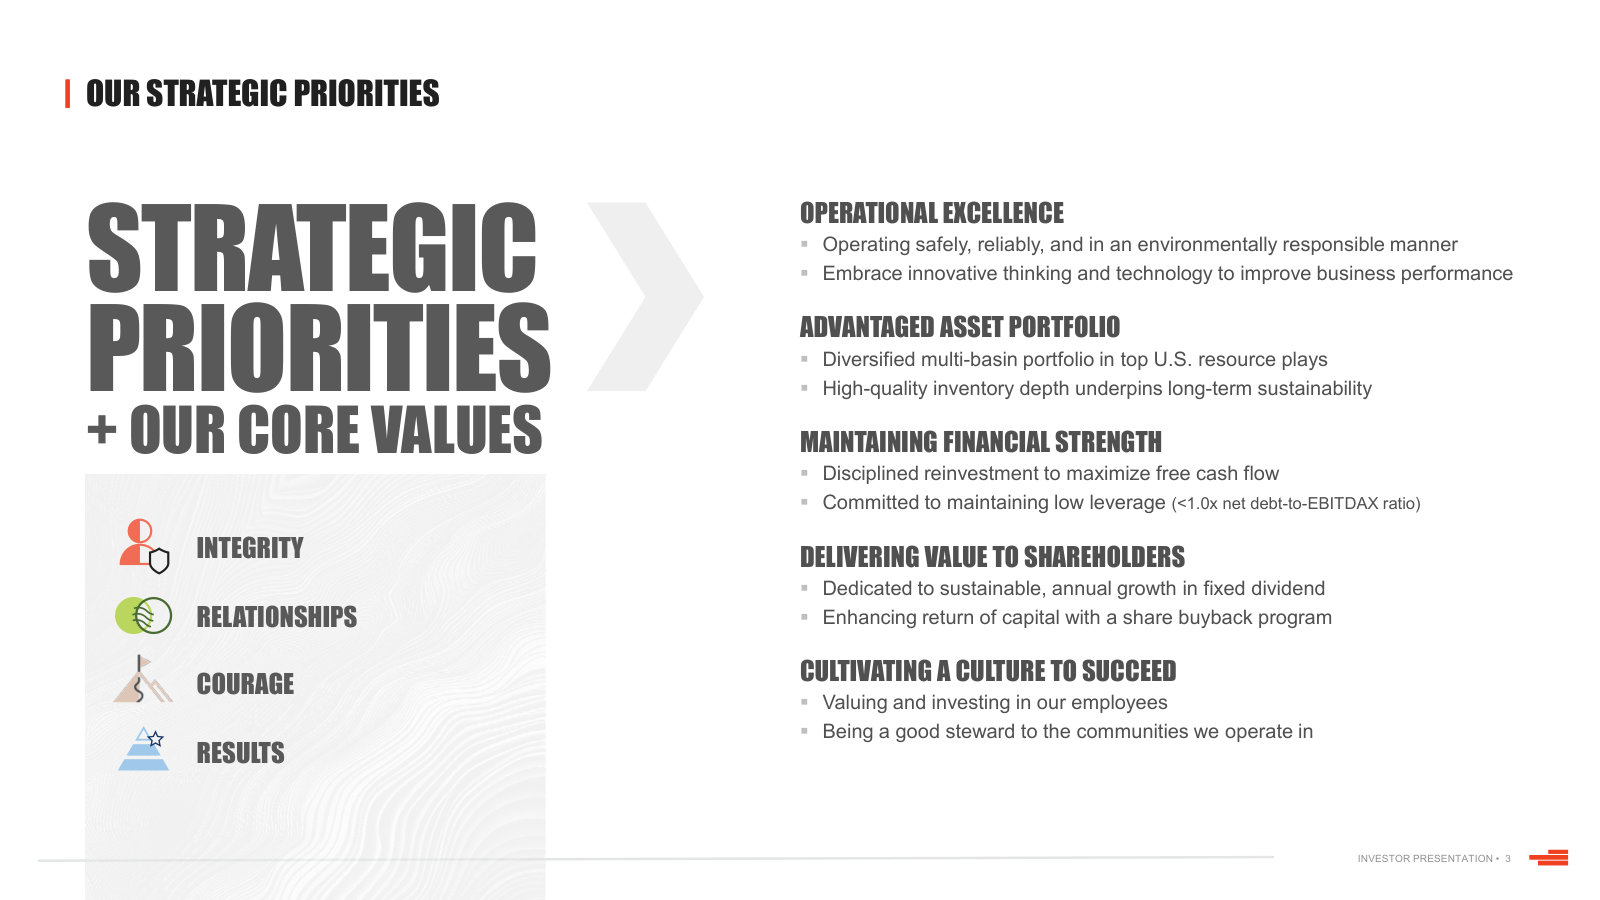
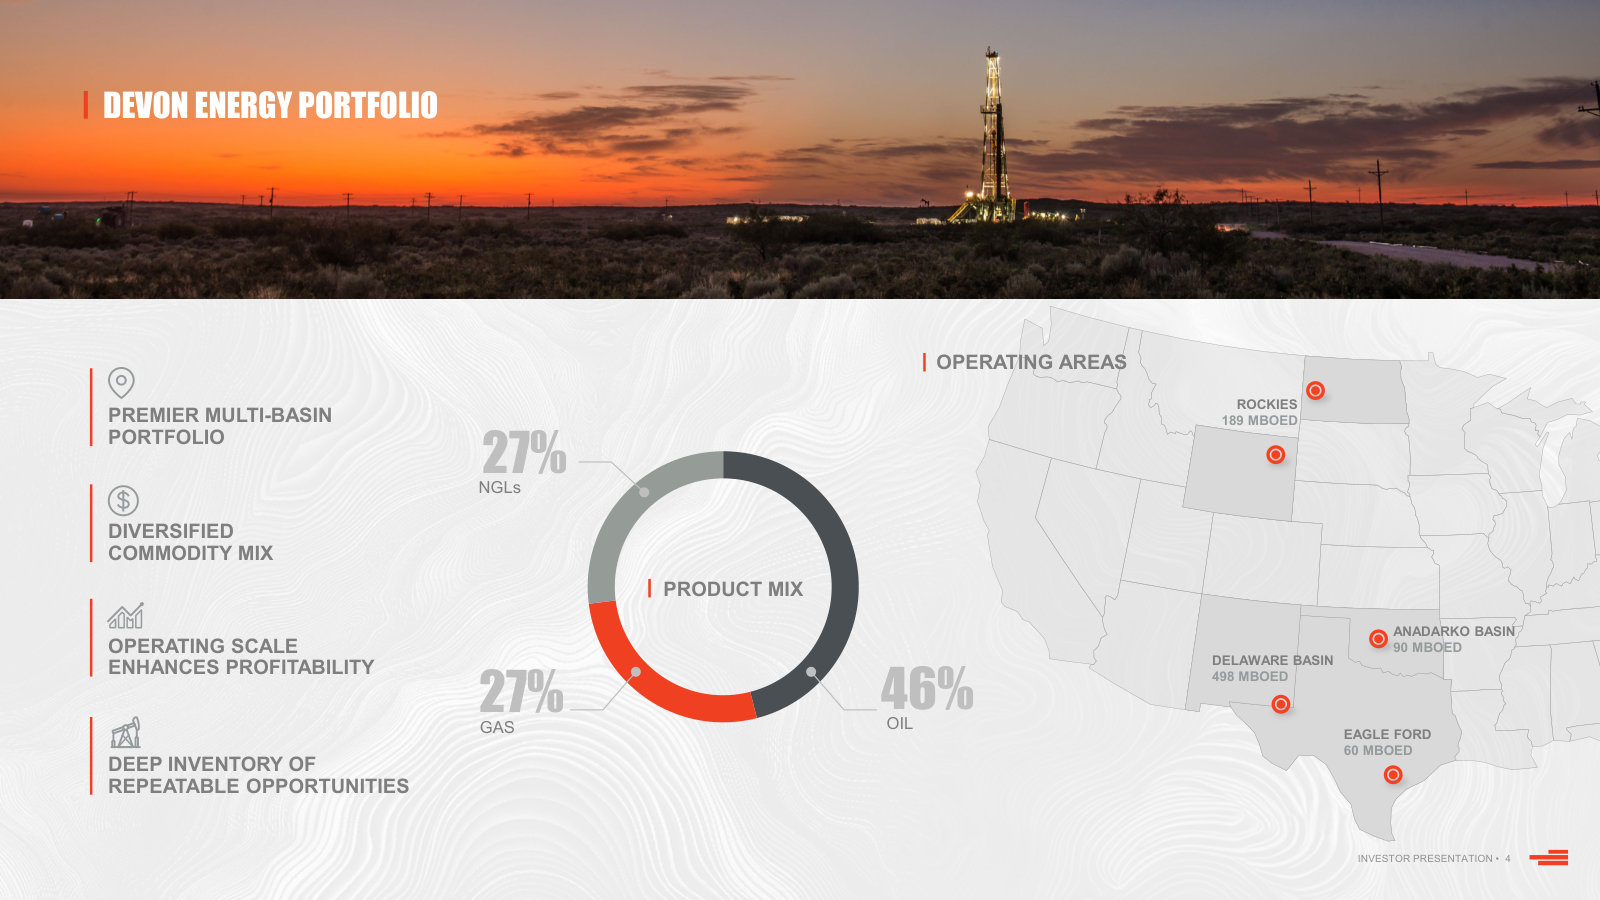
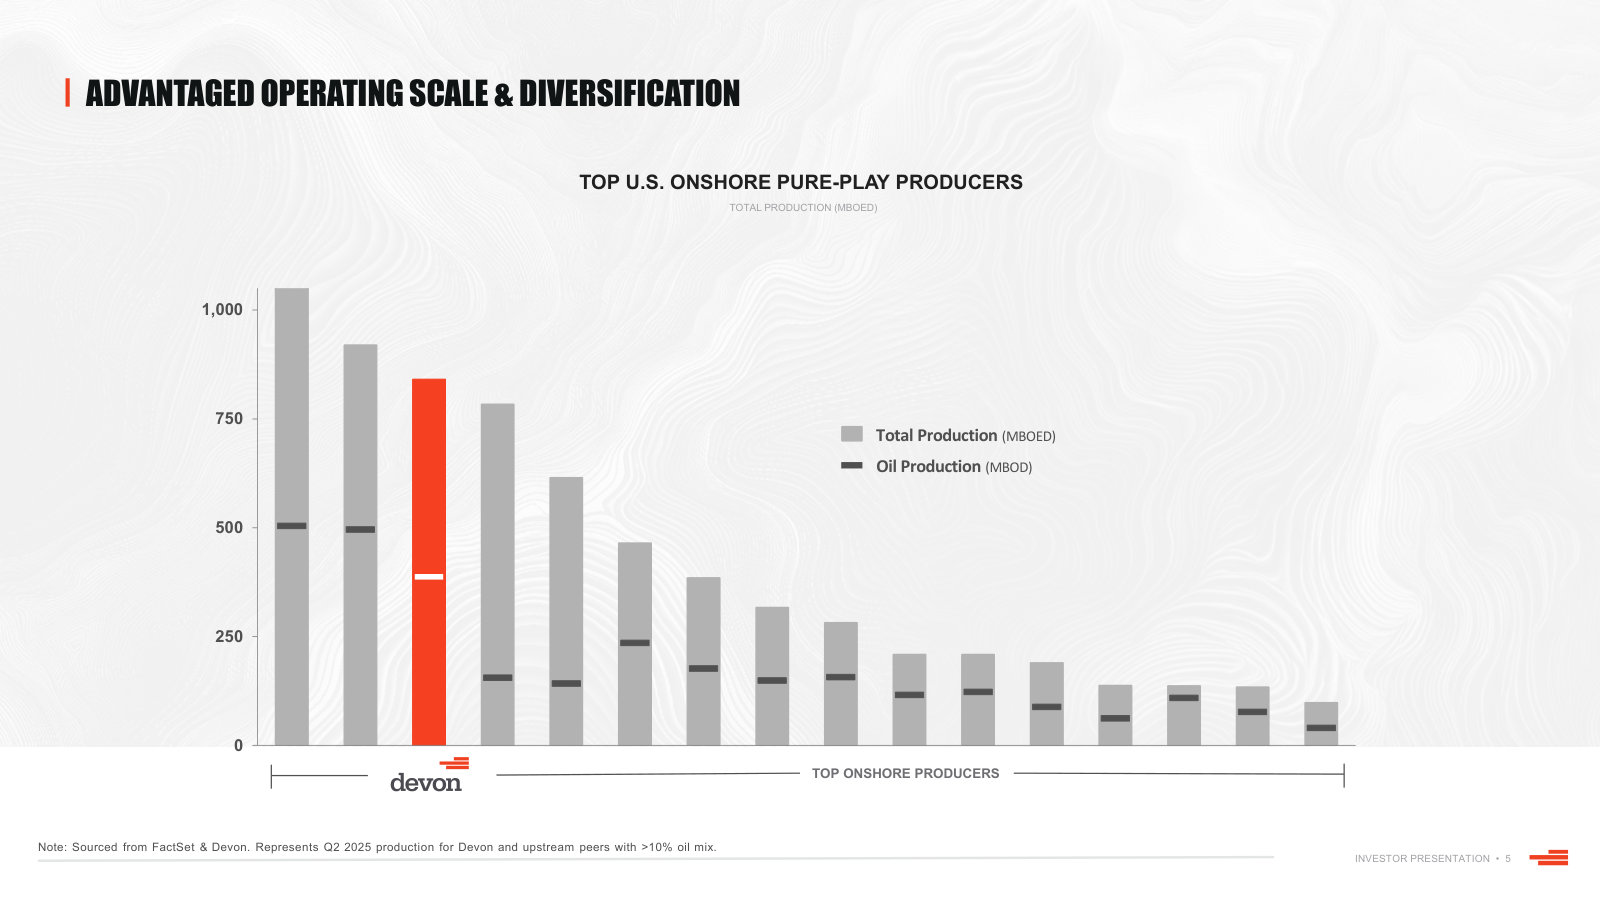
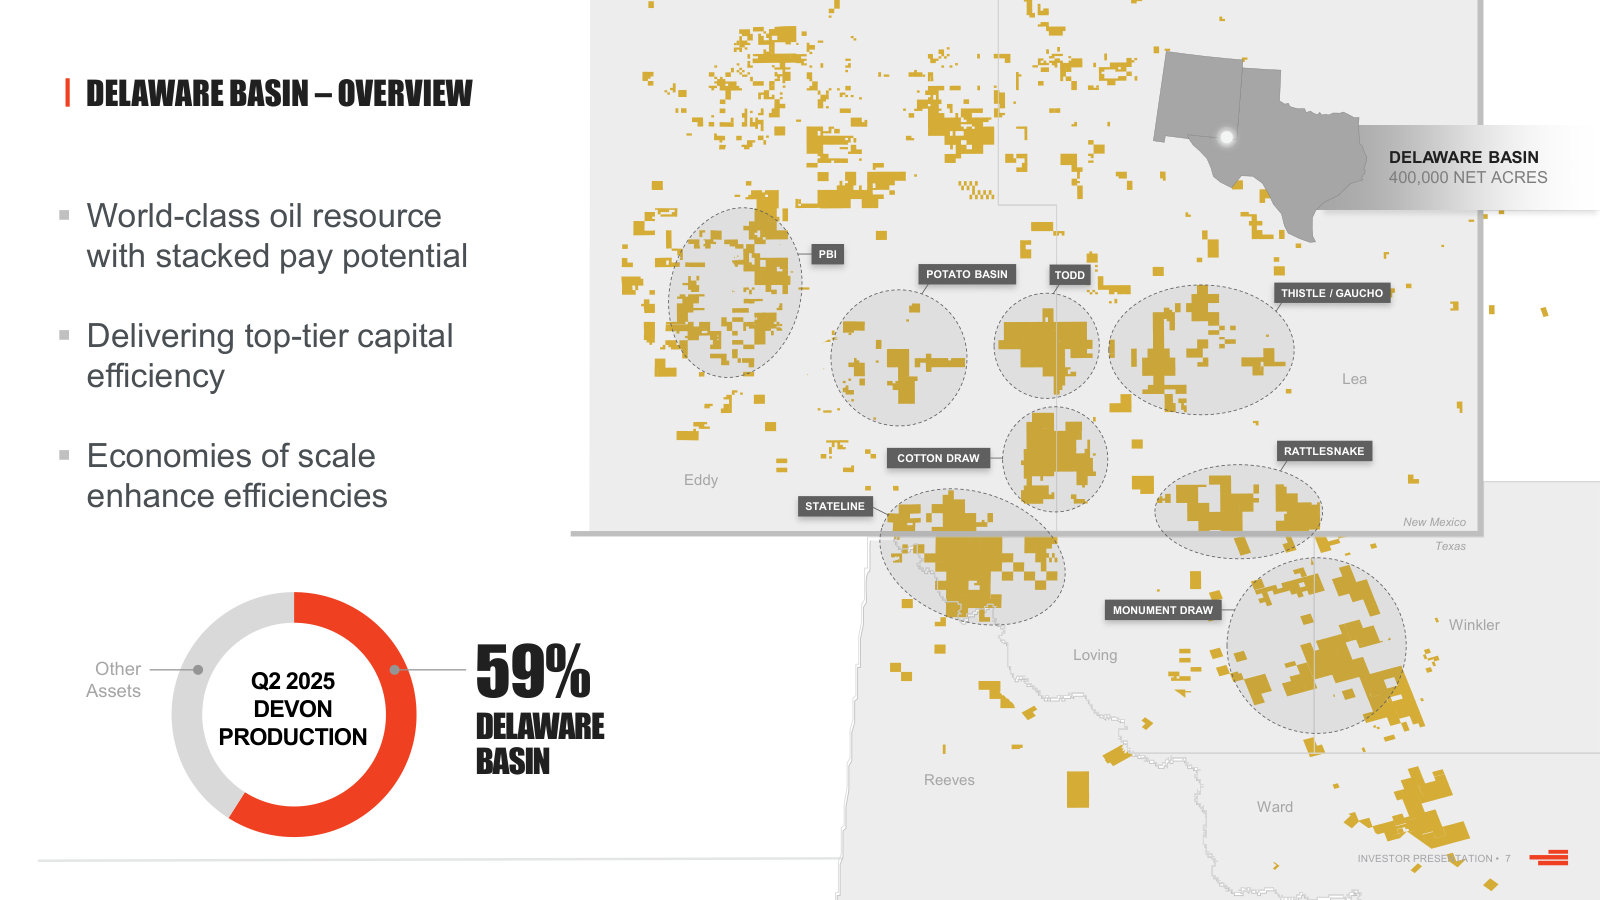
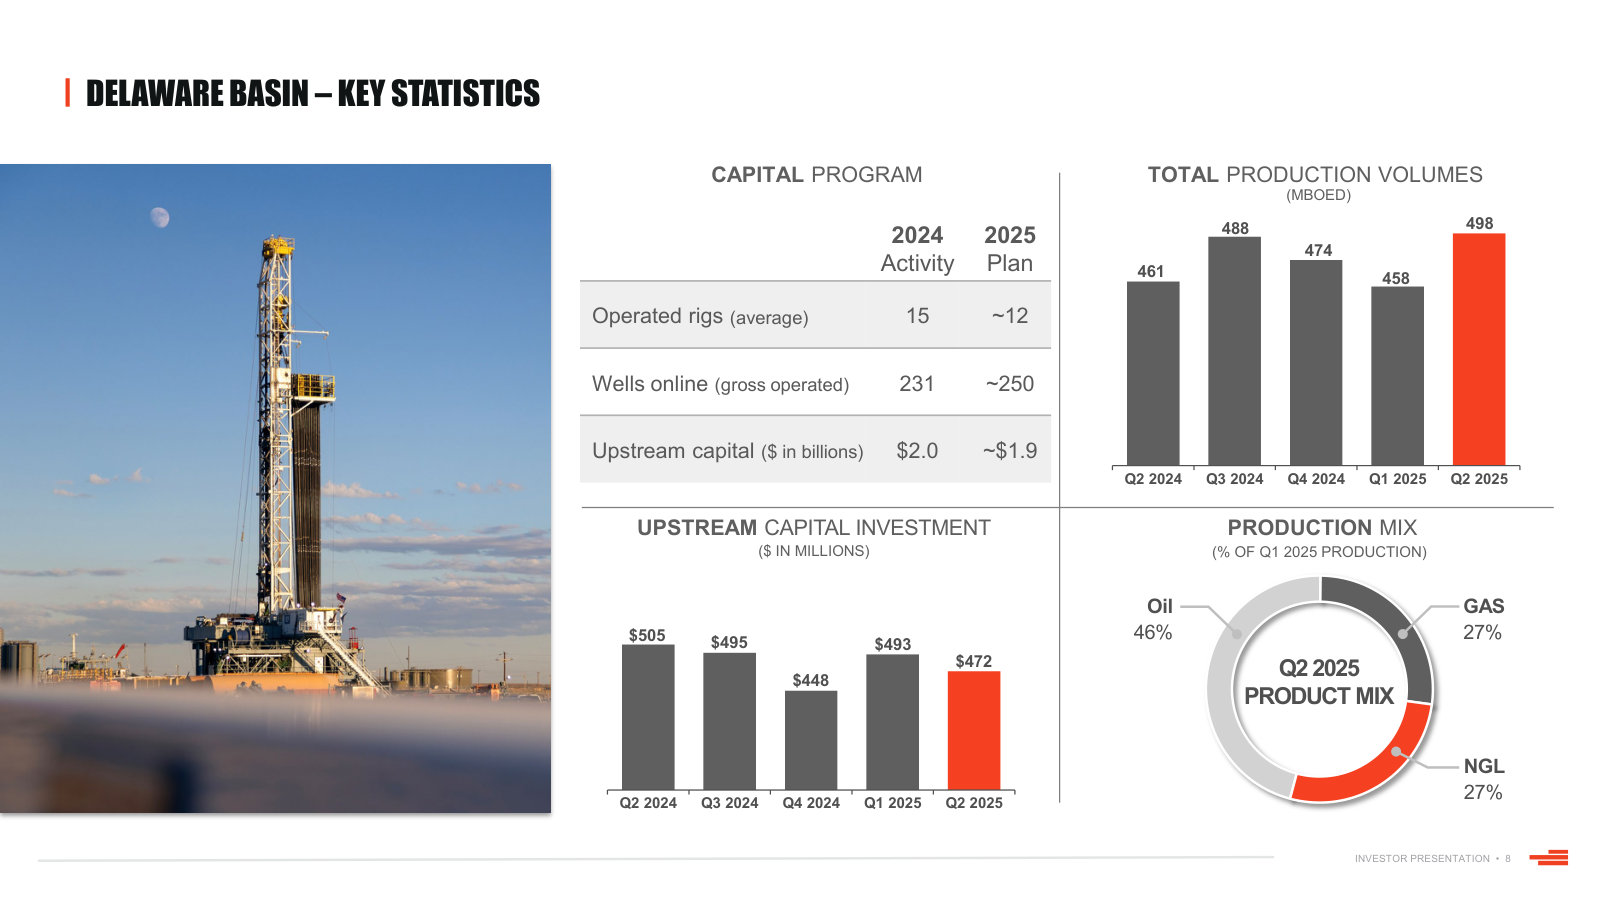
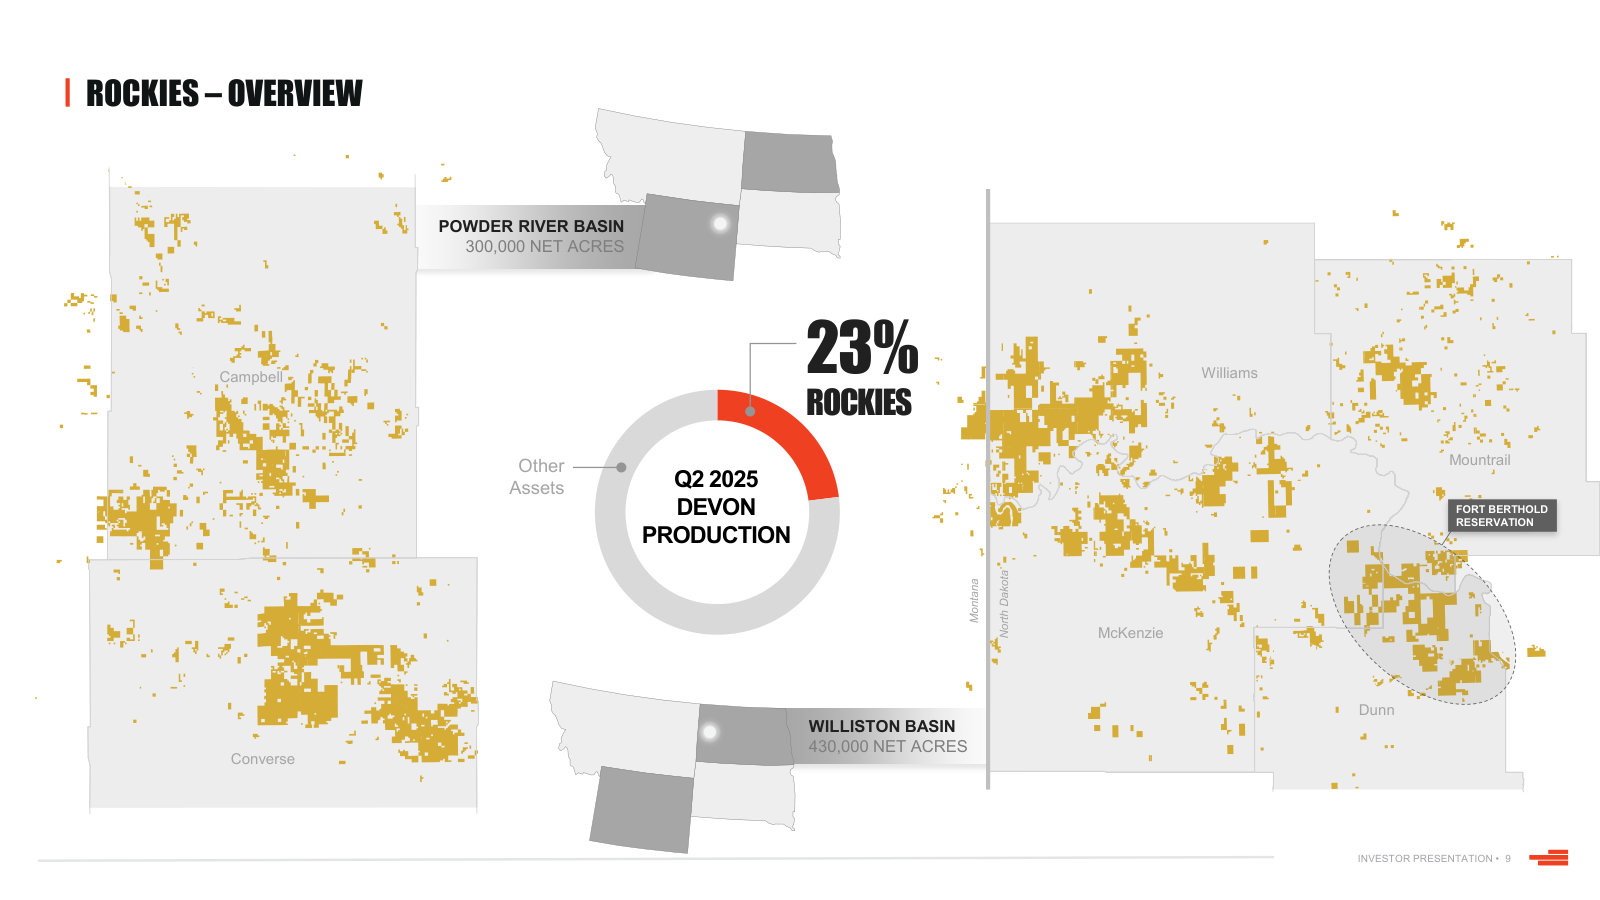
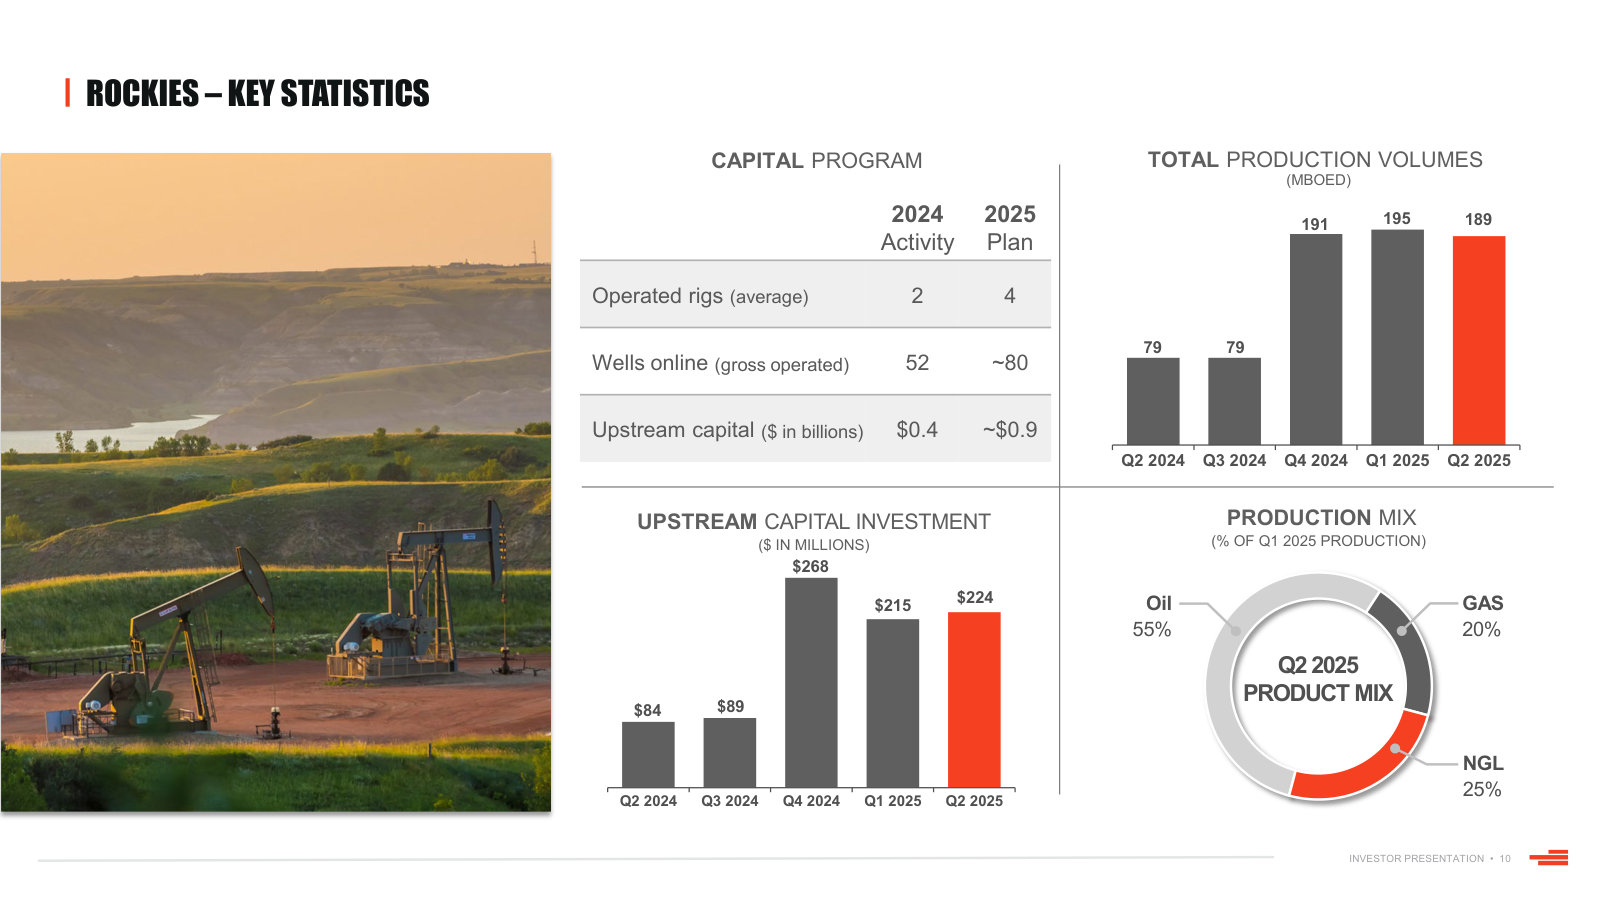
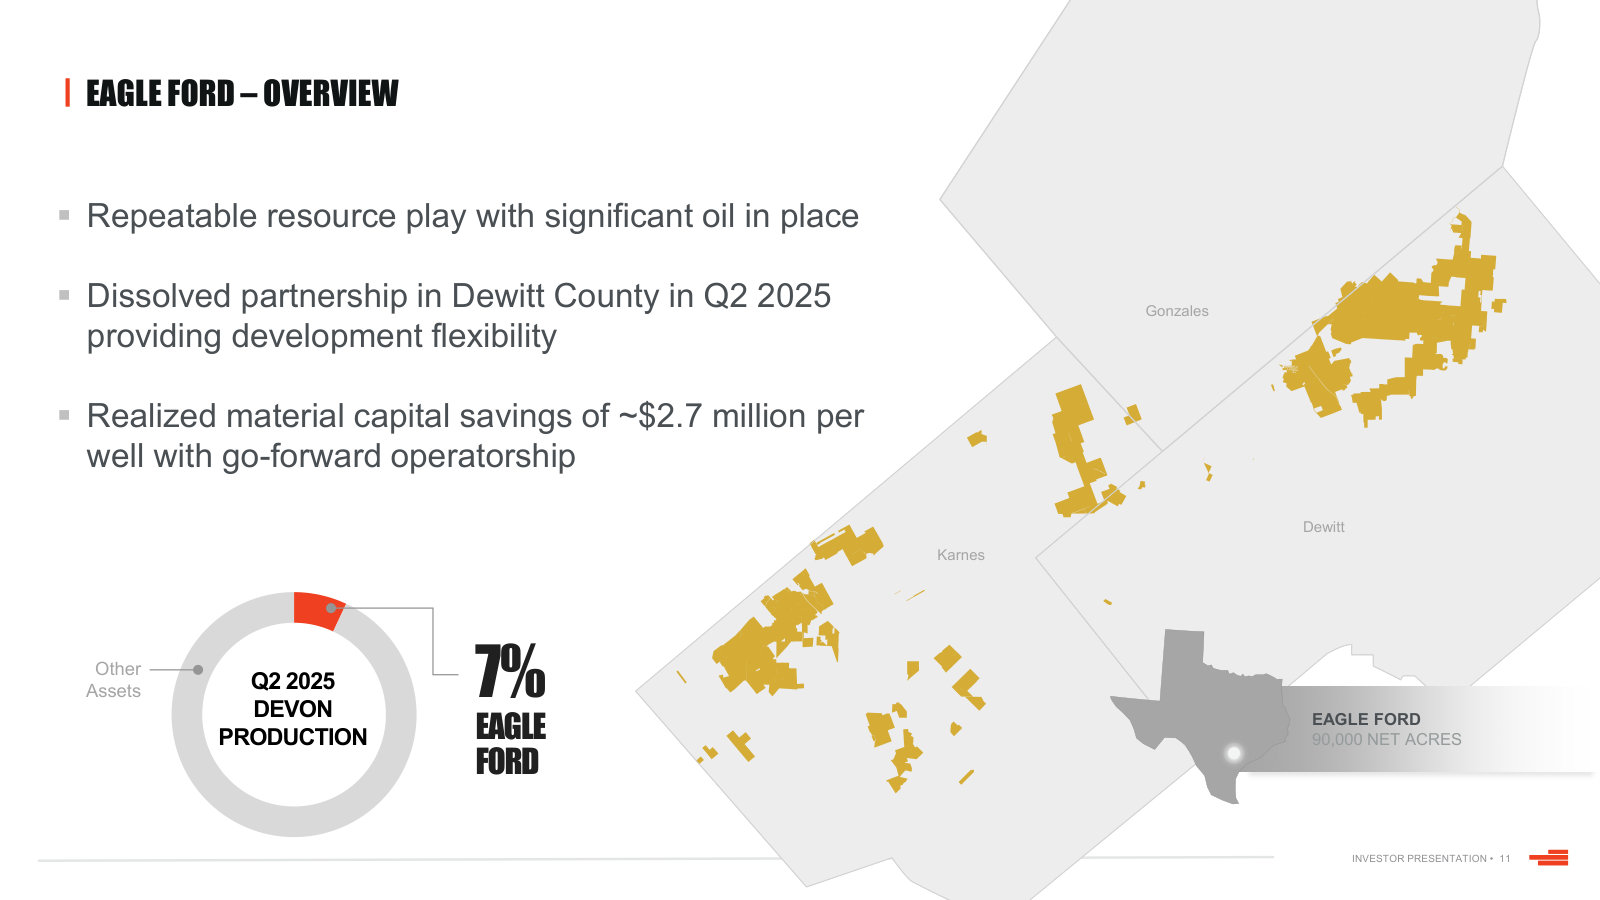
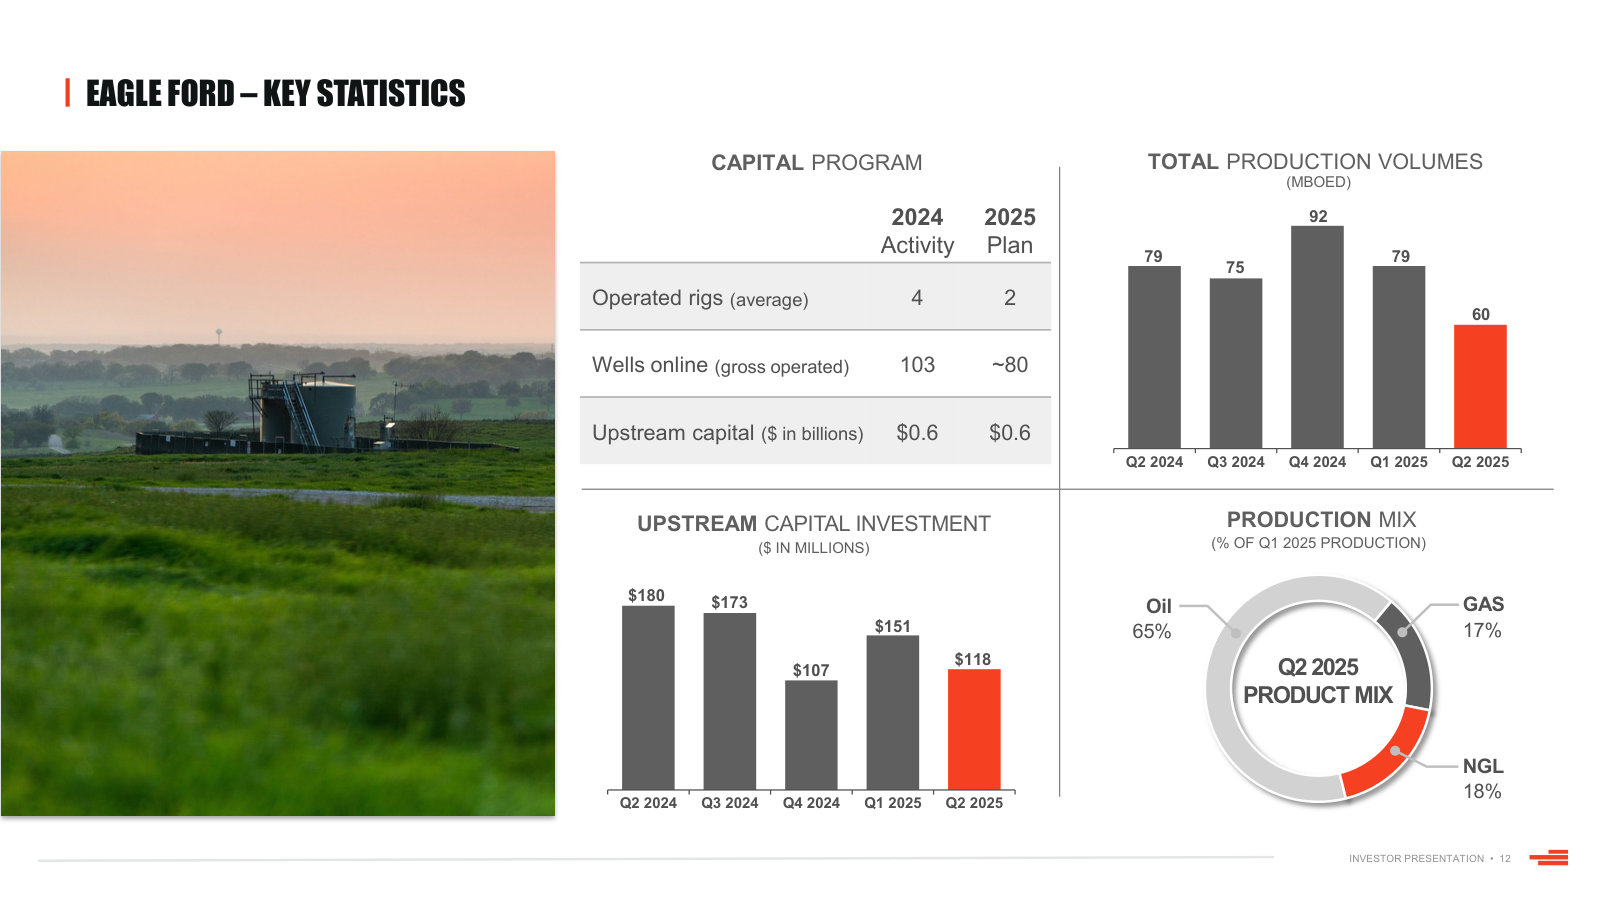
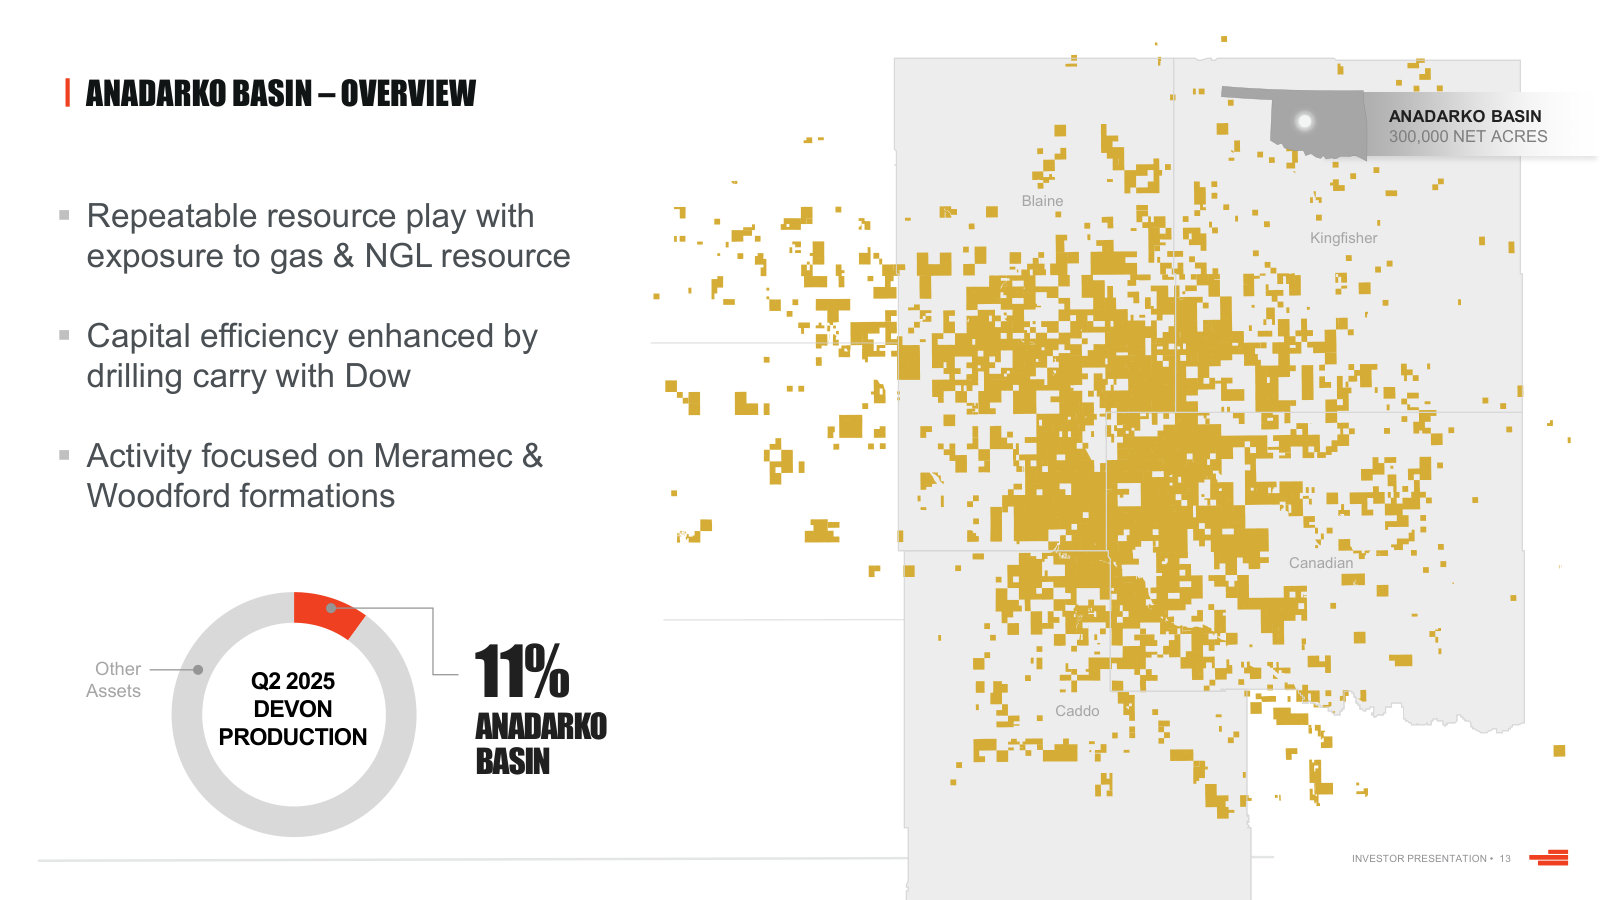
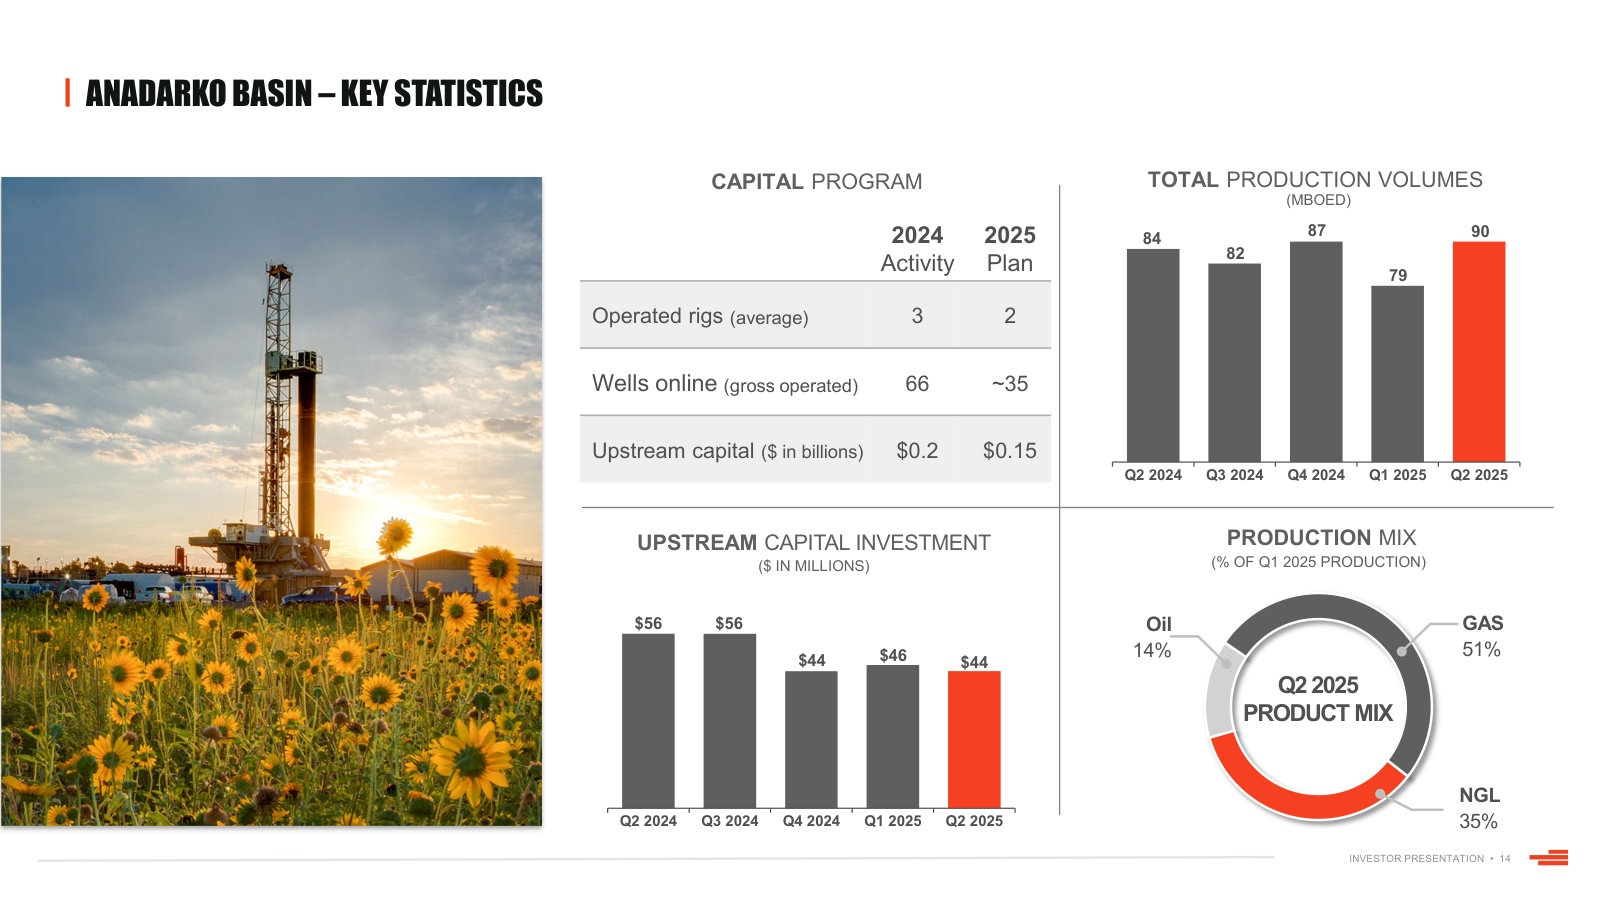
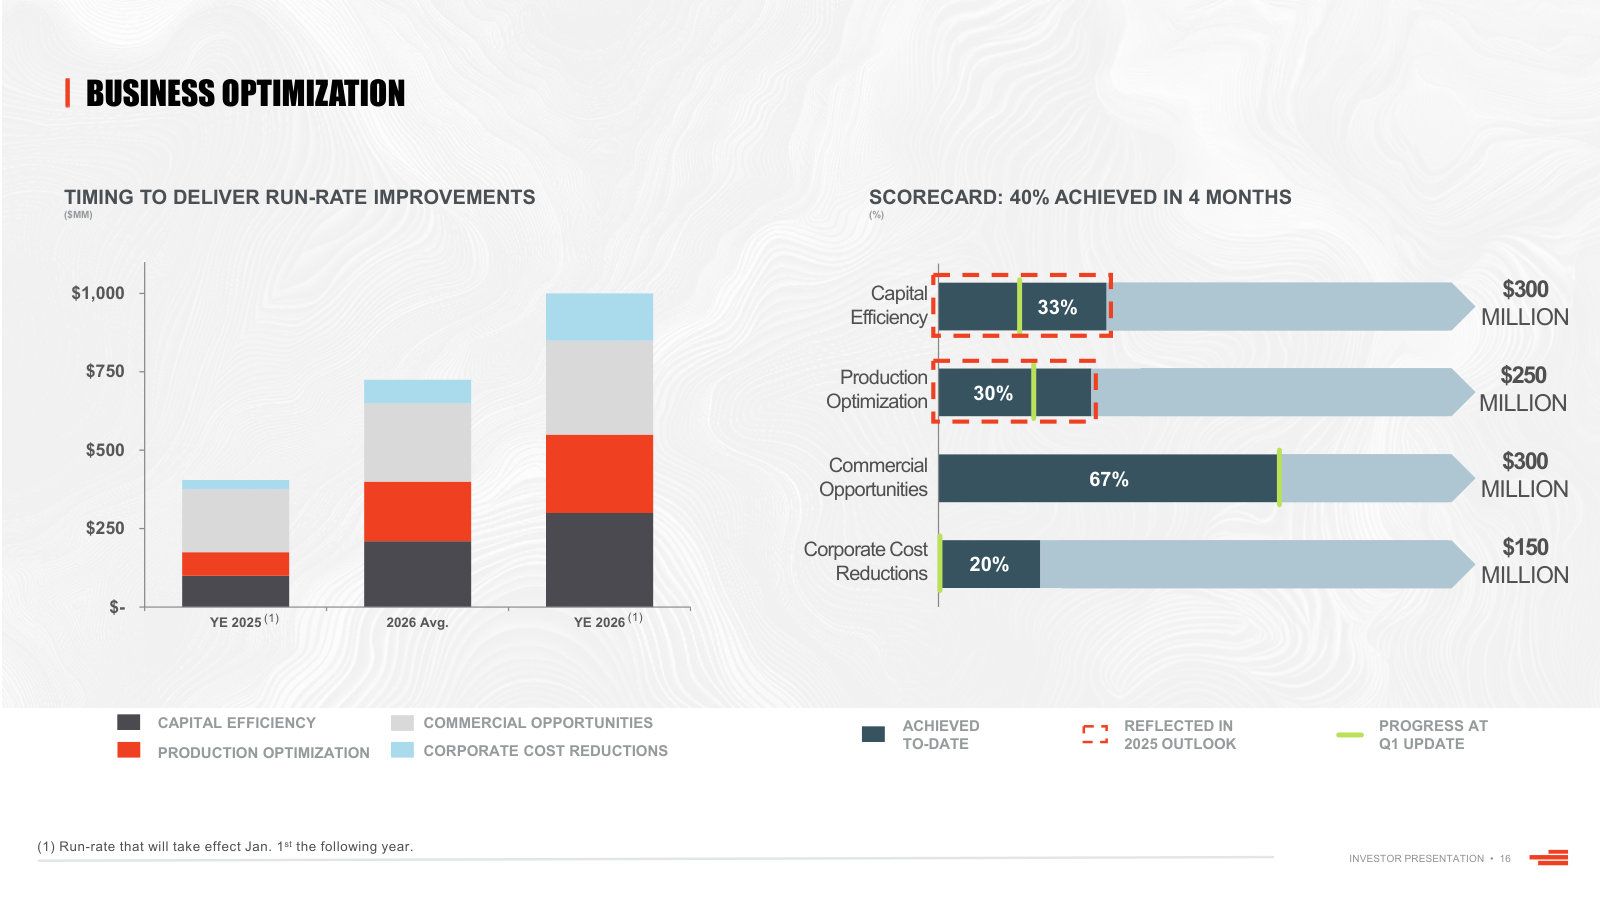
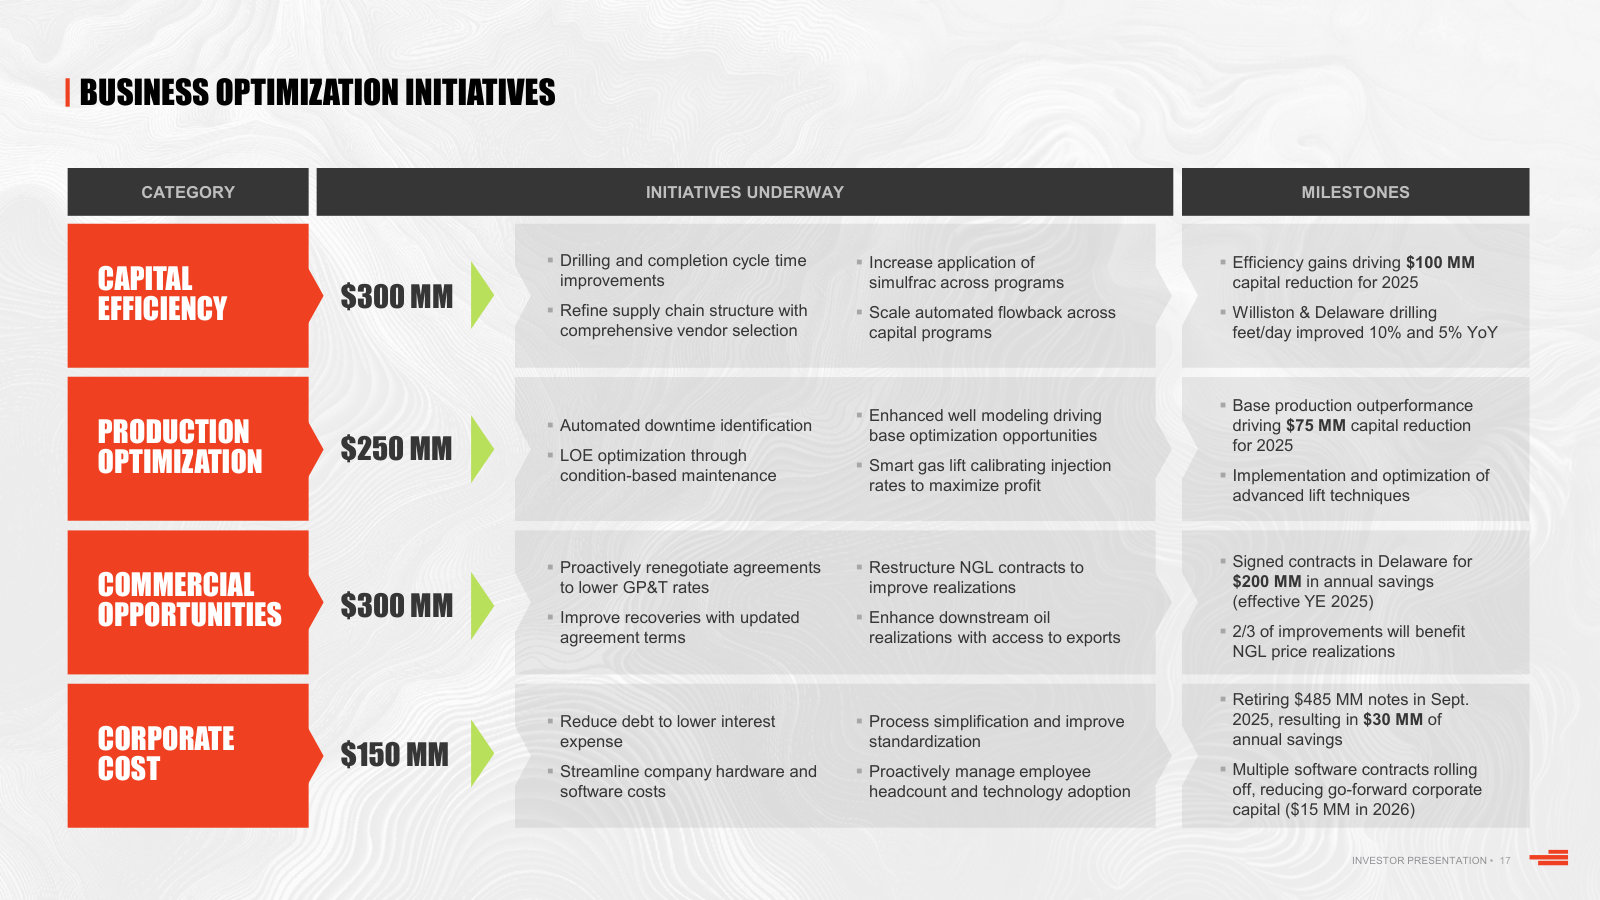
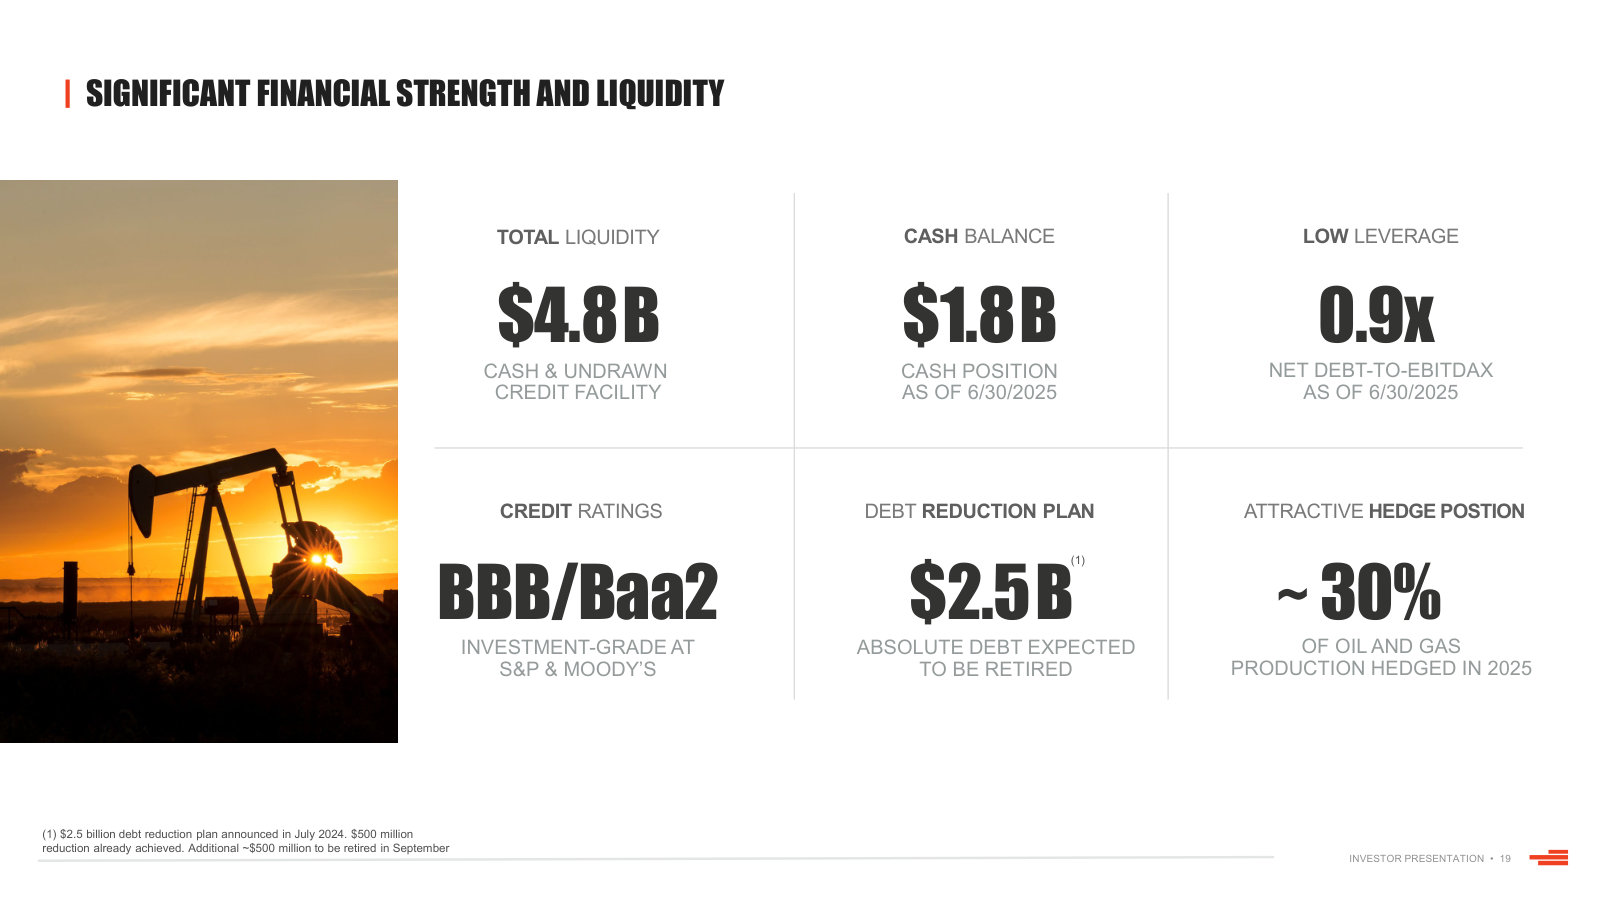
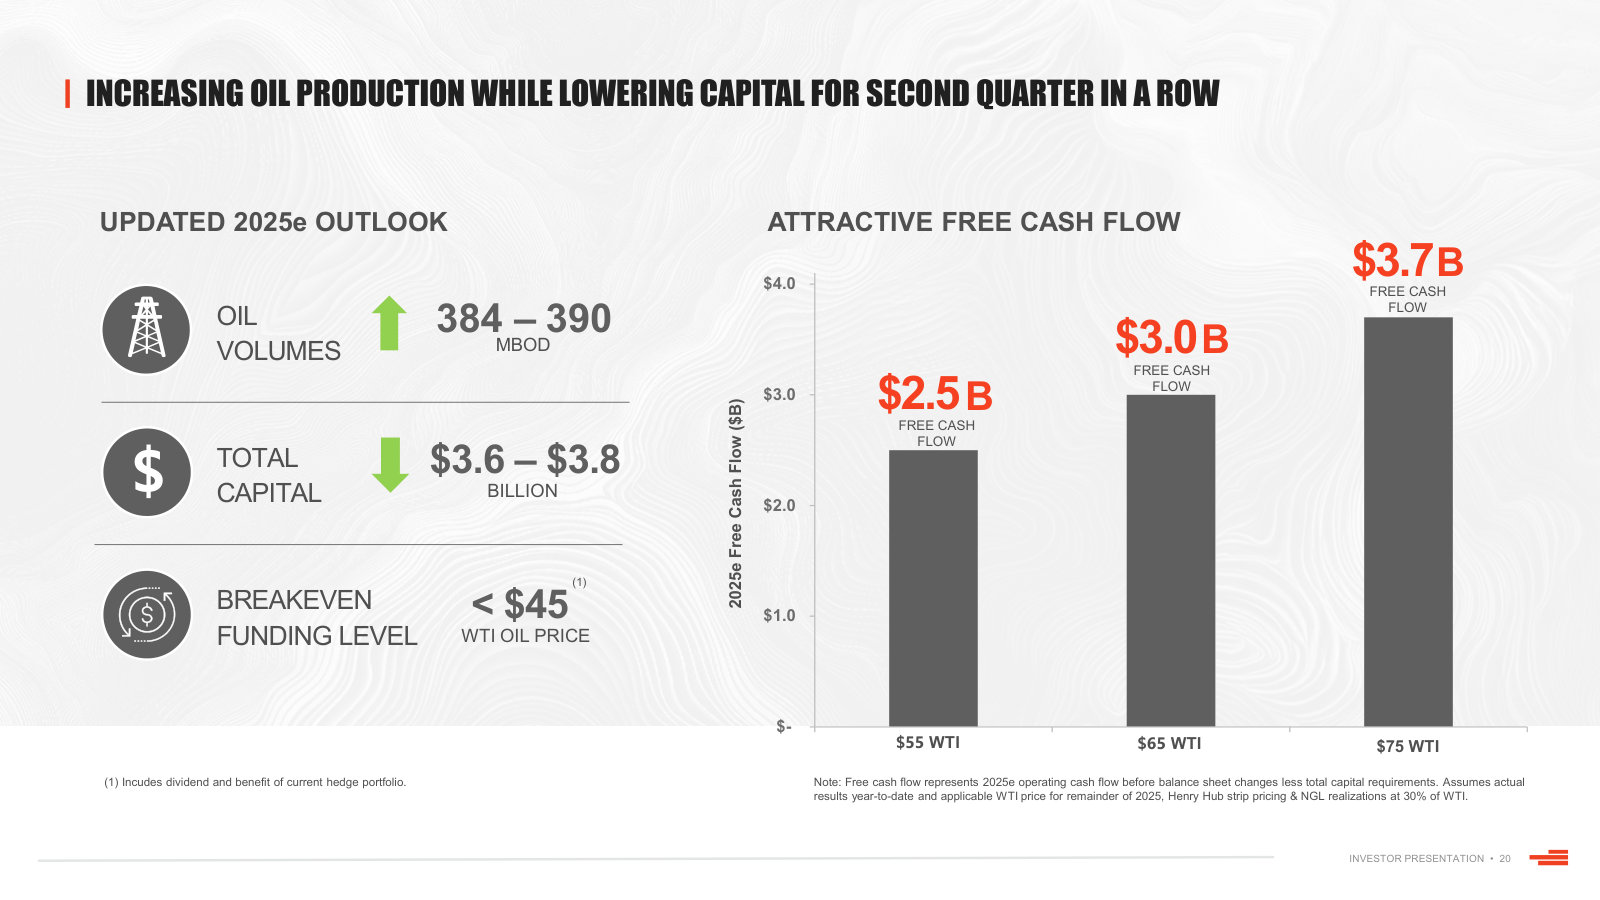
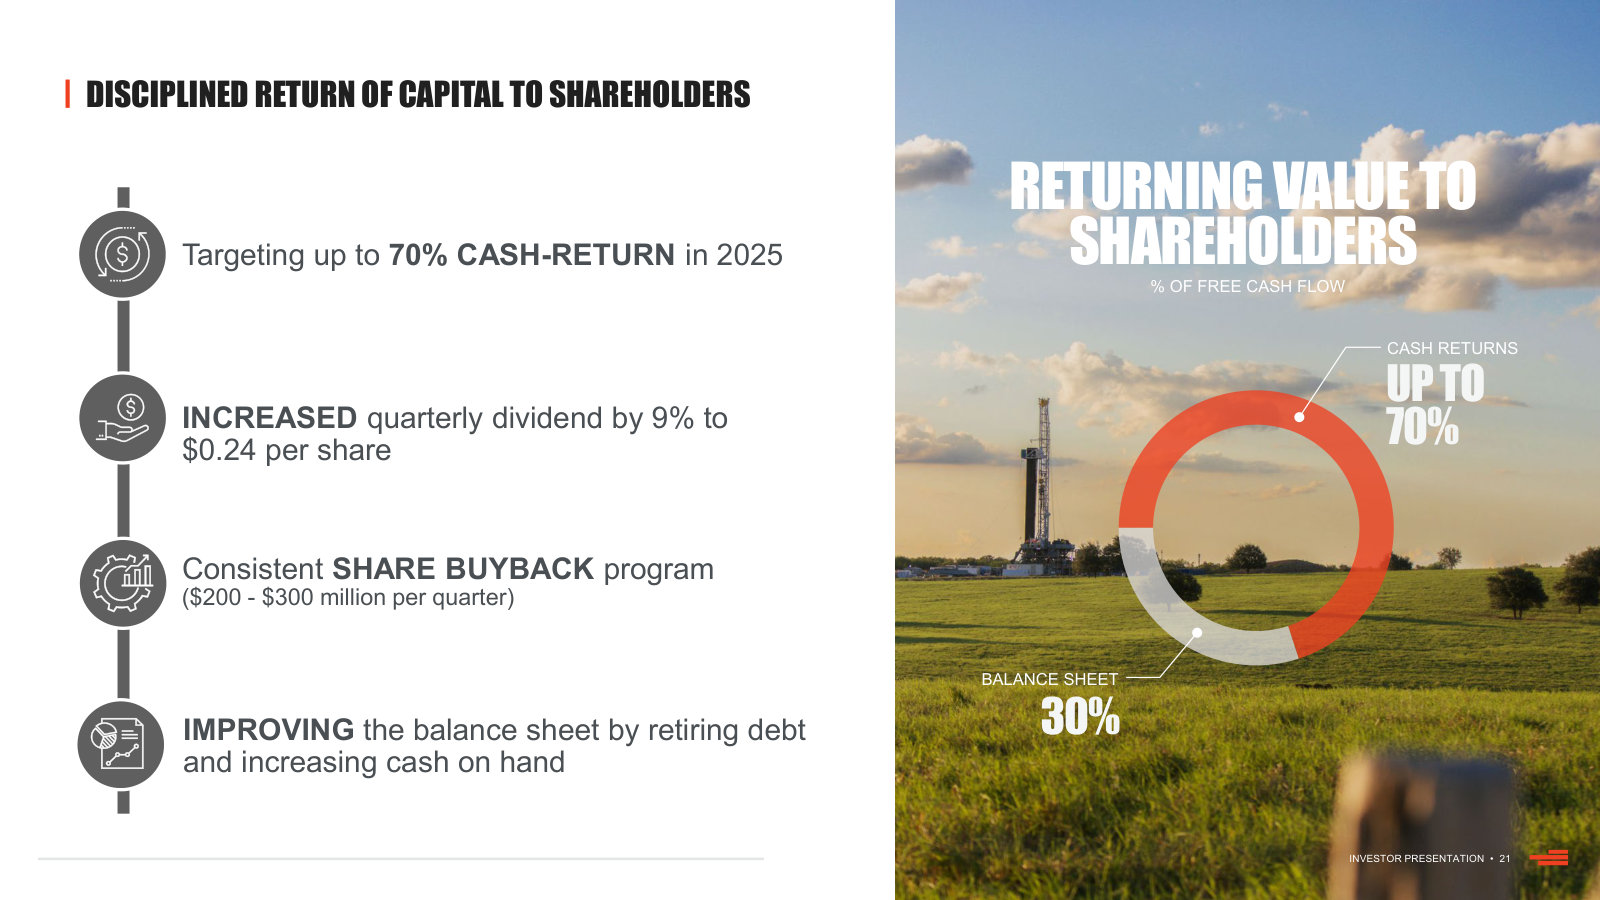
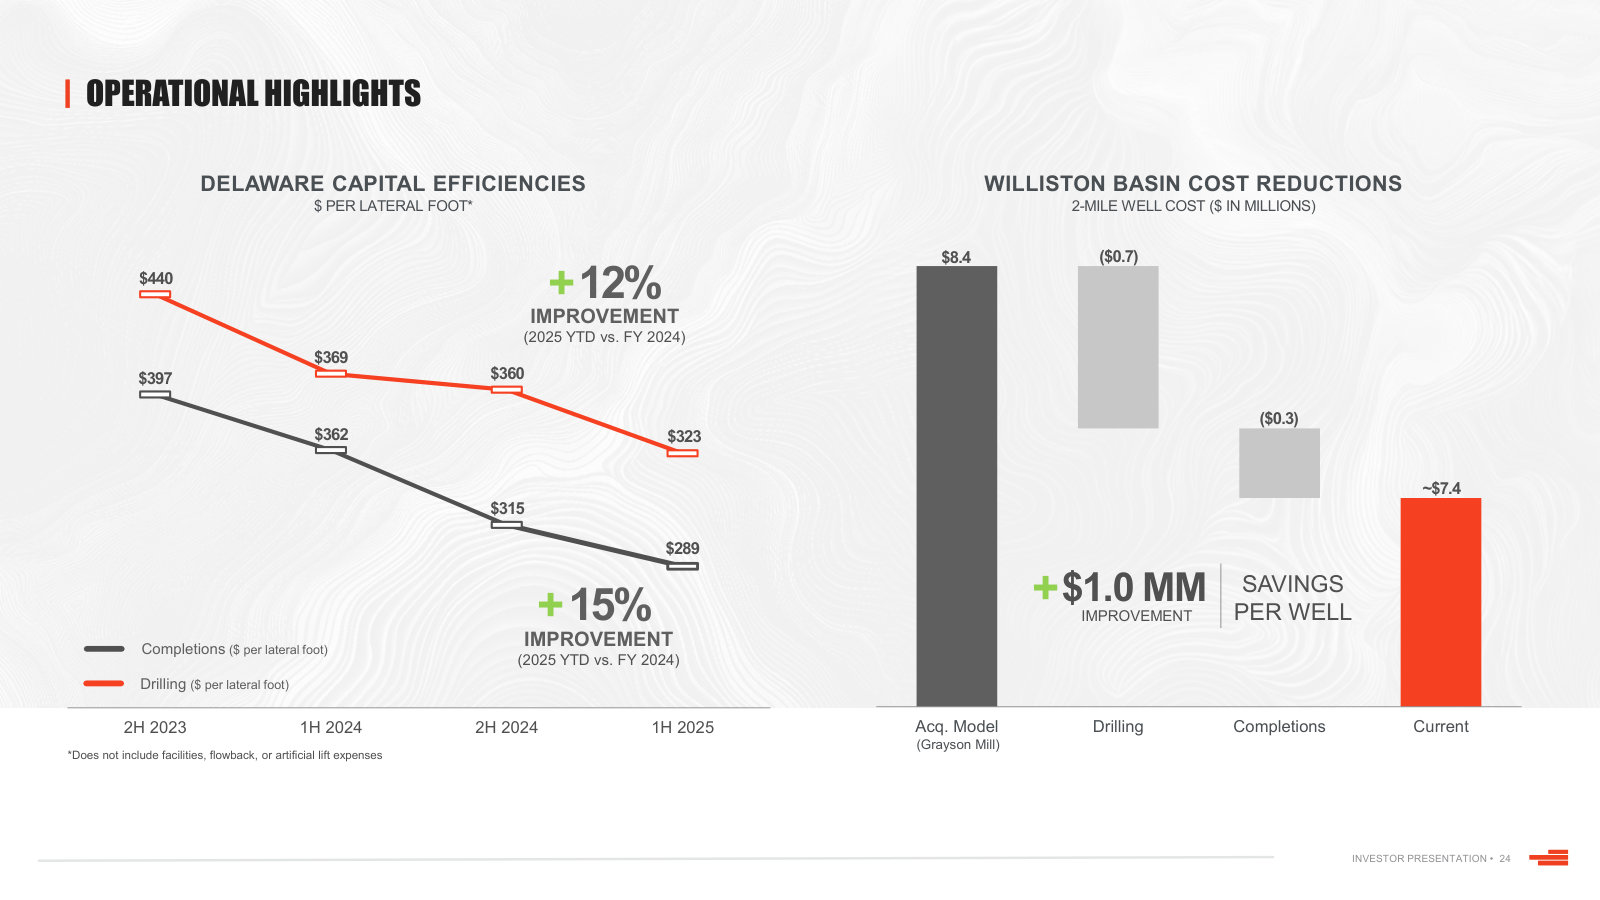
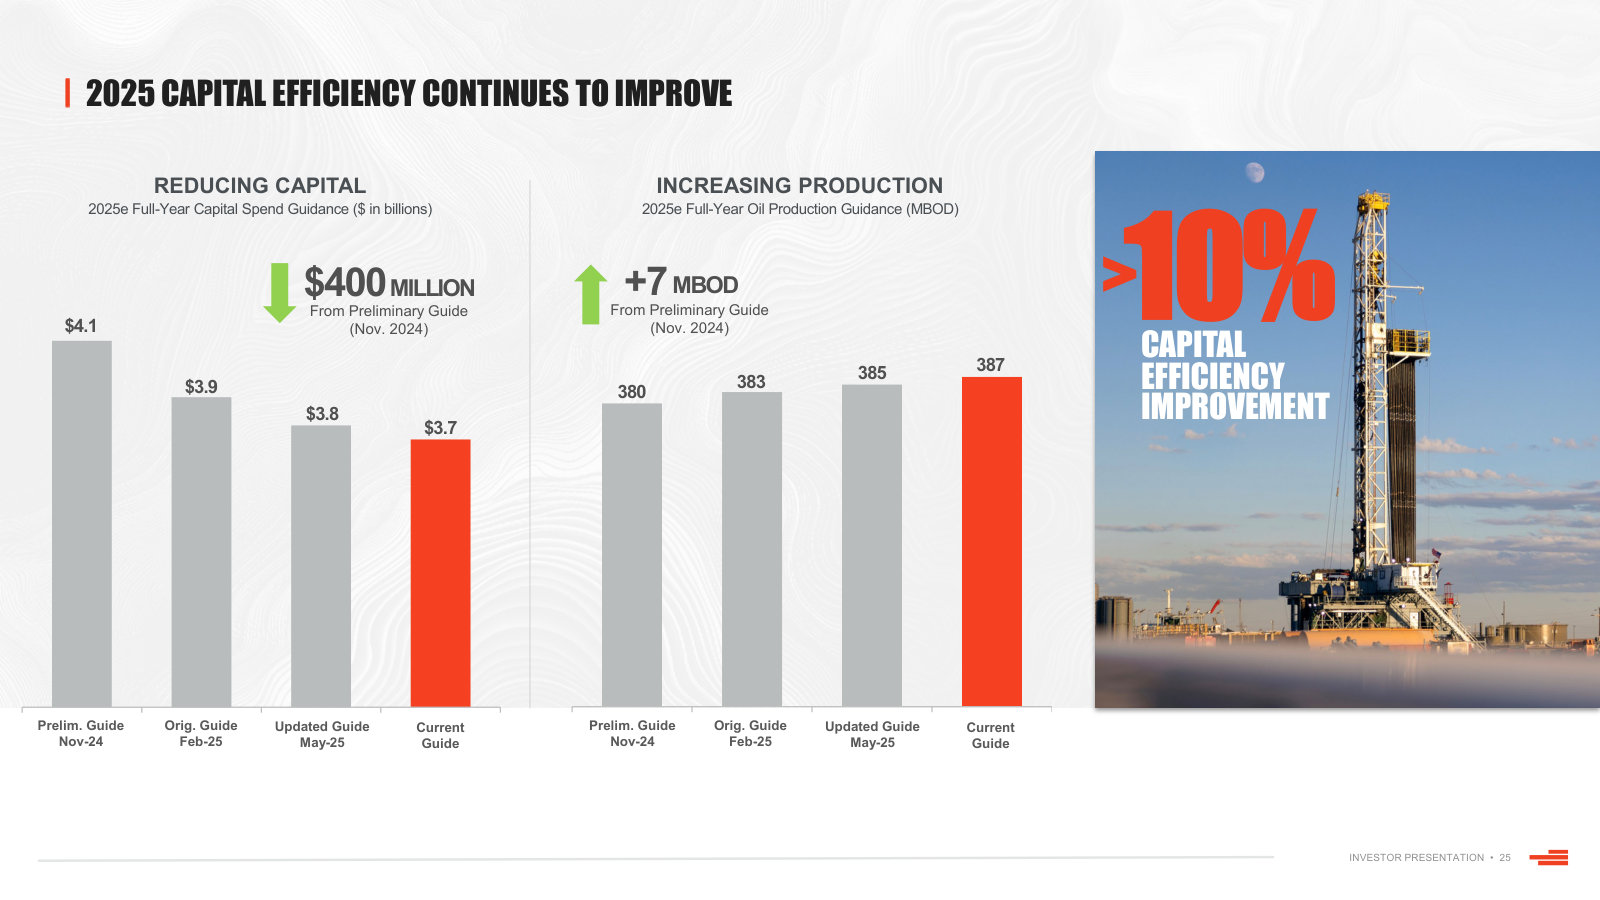
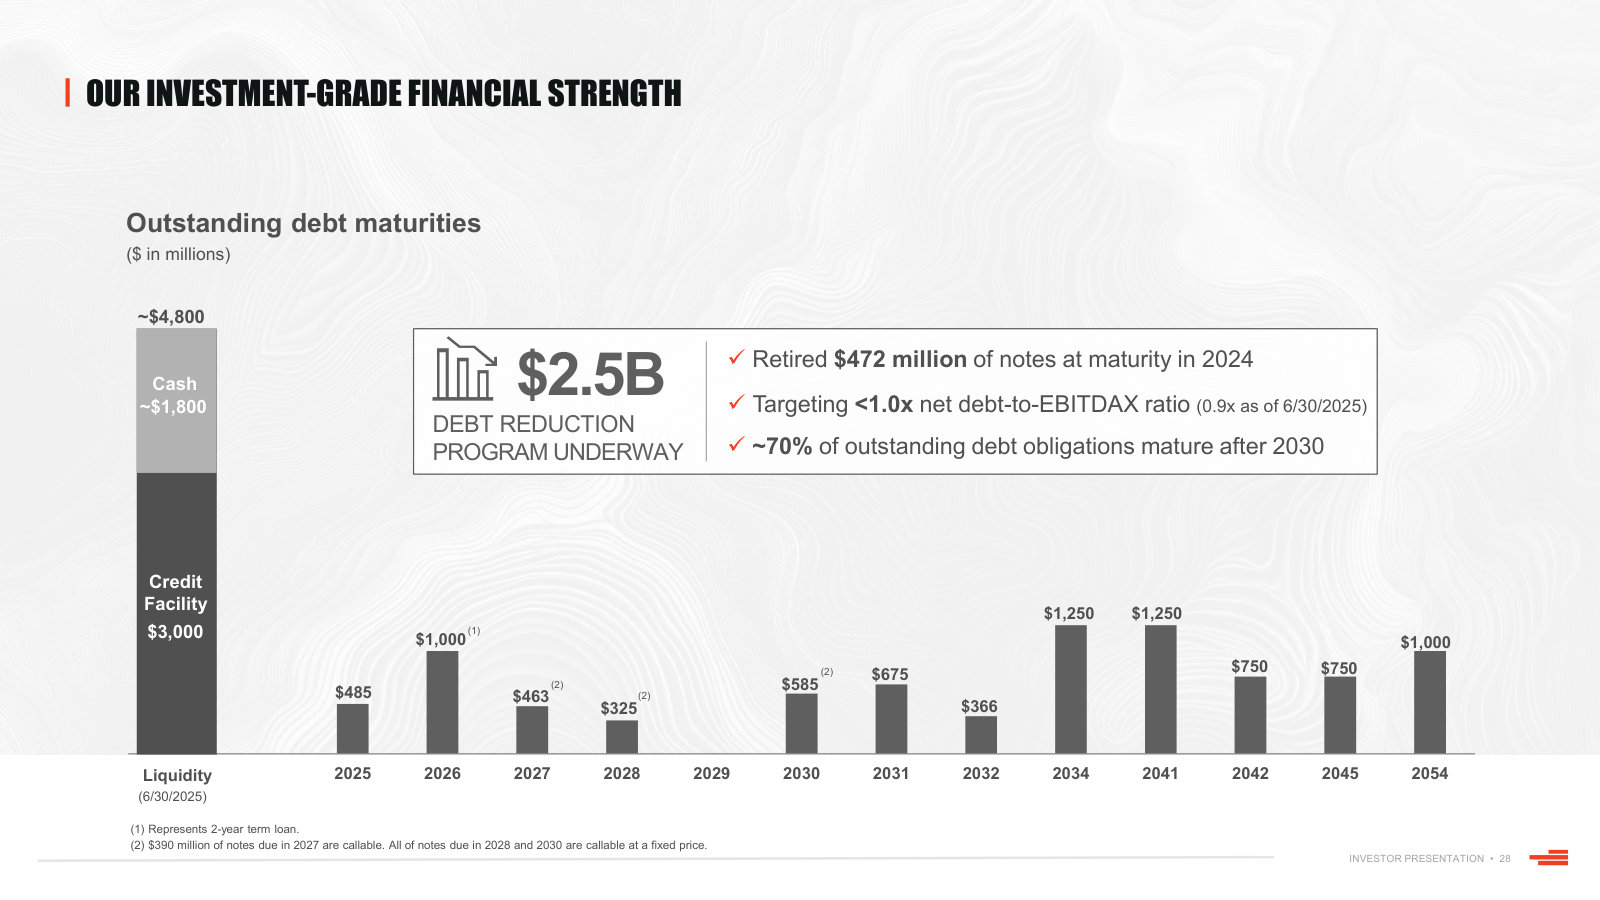
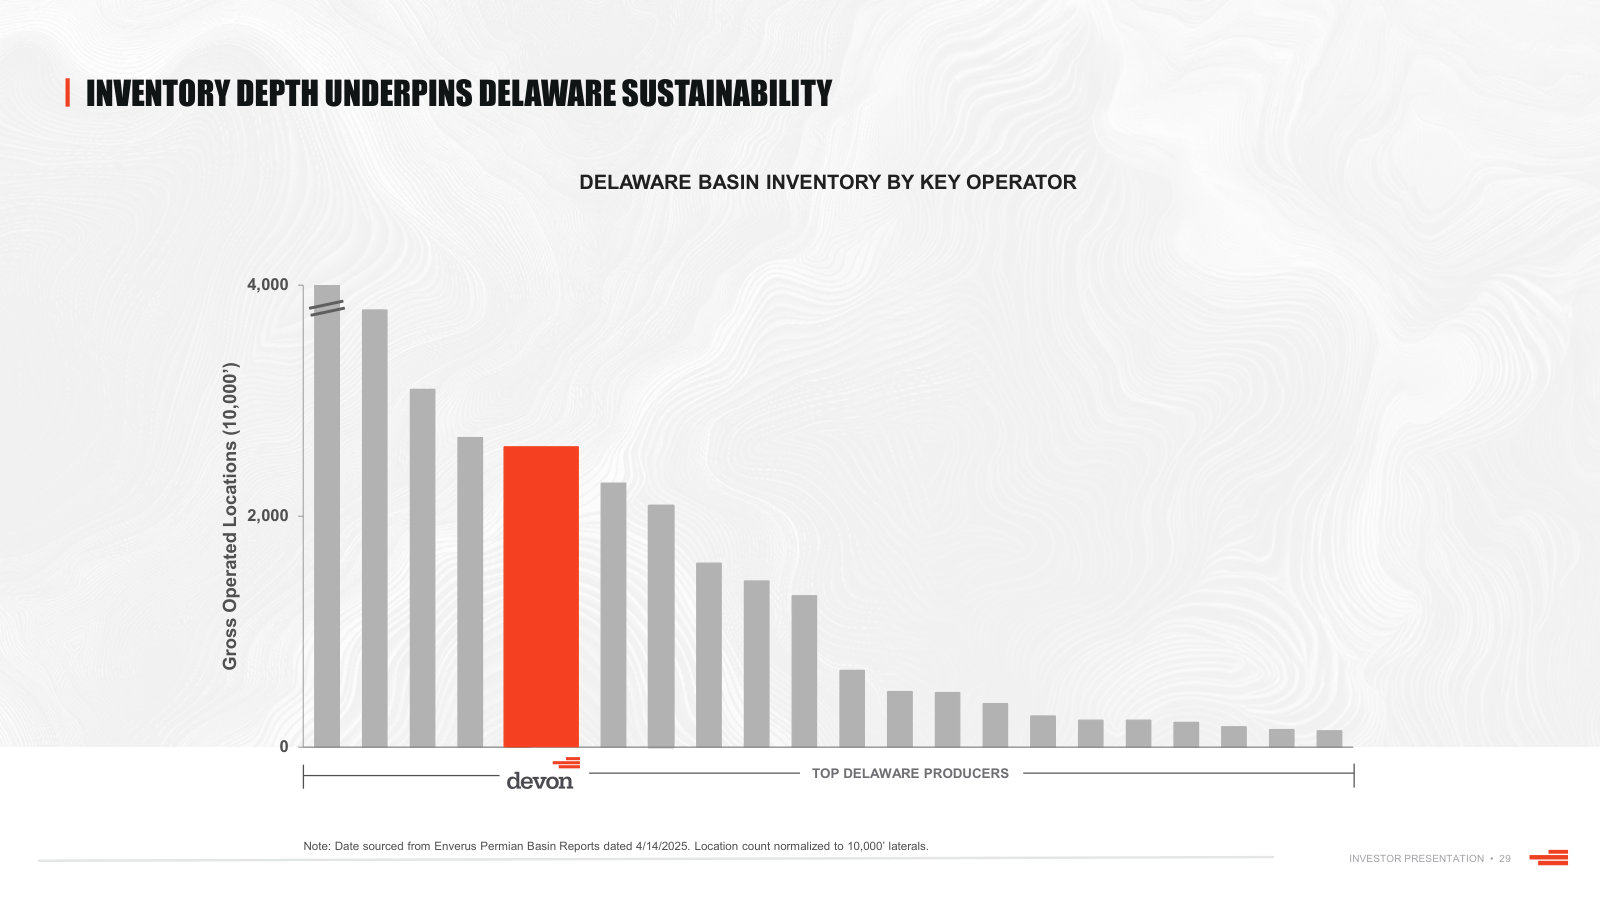
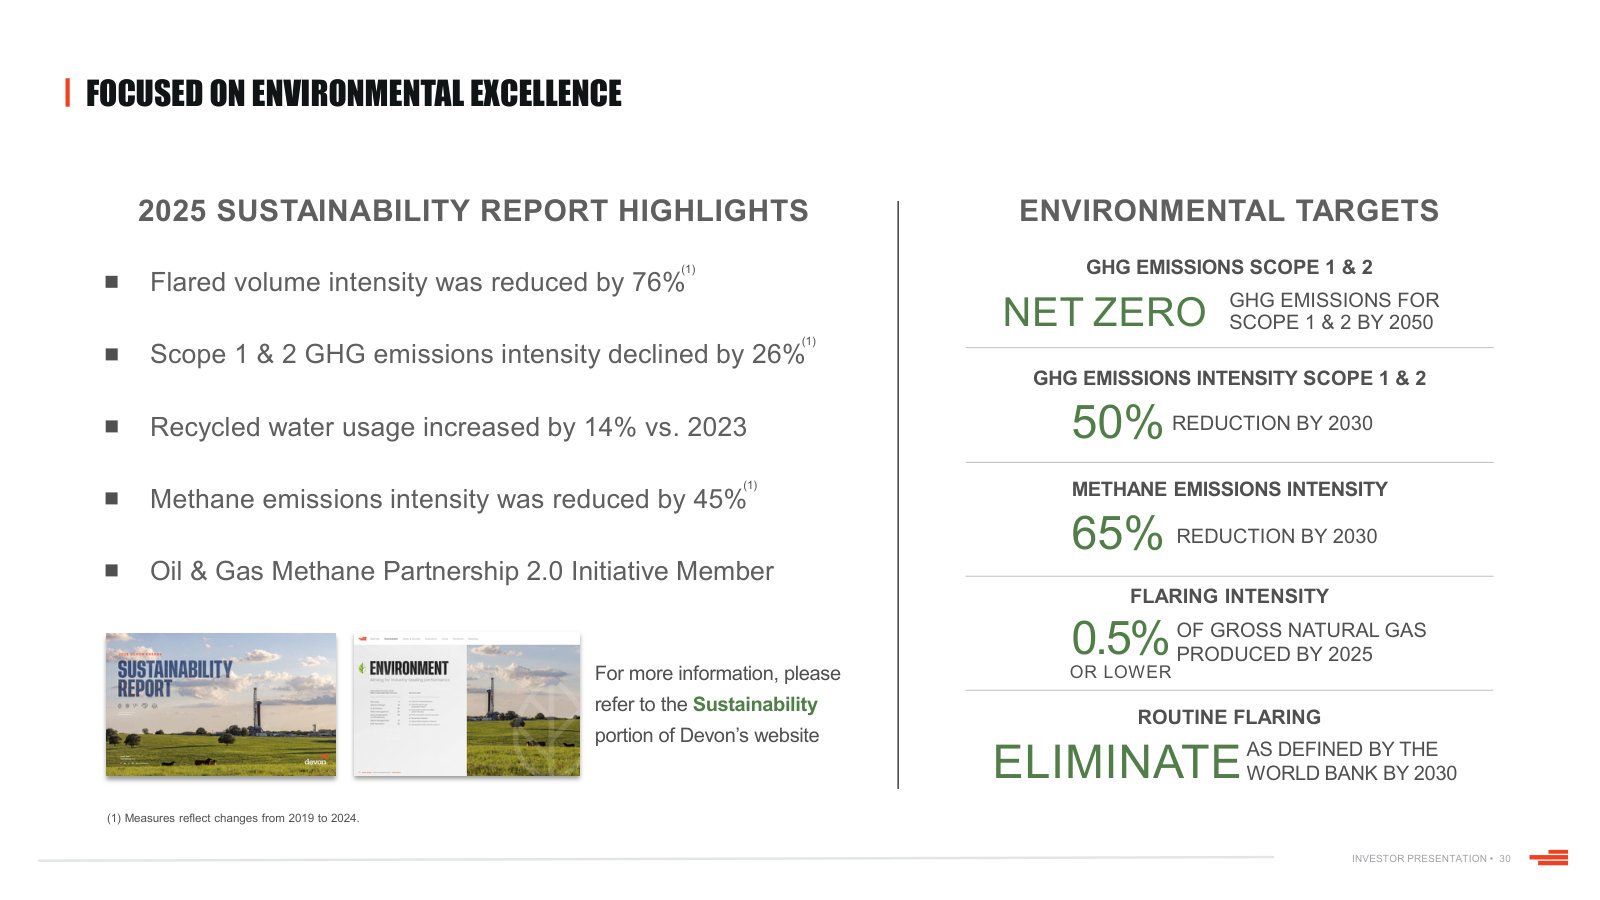
p. 2 — Devon at a glance before the merger: founded 1971, ~835 MBOED, 2,300 employees, ~$30bn enterprise value. · Open the full presentation →p. 3 — The five stated strategic priorities, unchanged through the merger and repeated in every subsequent deck. · Open the full presentation →p. 4 — The portfolio in one view — product mix roughly split oil, gas and NGLs, and production by operating area on a US map. · Open the full presentation →p. 5 — Devon's production against the other top US onshore pure-play producers, with oil volumes marked inside each bar. · Open the full presentation →p. 7 — Delaware Basin acreage map with the named development areas; 59% of production came from this one asset. · Open the full presentation →p. 8 — Delaware unit economics: rigs, wells online, capital, quarterly volumes and product mix — the template for the other basins. · Open the full presentation →p. 9 — The Rockies position: 430,000 net acres in the Williston plus 300,000 in the Powder River, 23% of production. · Open the full presentation →p. 10 — Rockies activity and spend, showing the step-up in rigs and capital after the Grayson Mill acquisition. · Open the full presentation →p. 11 — Eagle Ford acreage and the Dewitt County JV dissolution that cut ~$2.7 million per well. · Open the full presentation →p. 12 — Eagle Ford by the numbers — the most oil-weighted asset at 65% oil, on a declining rig count. · Open the full presentation →p. 13 — The Anadarko position: 300,000 net acres, gas and NGL weighted, with capital carried by the Dow drilling agreement. · Open the full presentation →p. 14 — Anadarko activity and mix — 51% gas, the smallest capital program, run for cash rather than growth. · Open the full presentation →p. 16 — The $1bn business optimization program as first scored: four categories, target amounts and progress at four months. · Open the full presentation →p. 17 — The initiative list behind each category, with the specific milestones management committed to. · Open the full presentation →p. 19 — Balance sheet position mid-2025: $4.8bn liquidity, 0.9x leverage, BBB/Baa2, and roughly 30% of production hedged. · Open the full presentation →p. 20 — 2025 guidance with free cash flow at $55, $65 and $75 WTI — the sensitivity that drives everything downstream. · Open the full presentation →p. 21 — The pre-merger return-of-capital policy: up to 70% of free cash flow, dividend plus buyback plus debt retirement. · Open the full presentation →p. 24 — Drilling and completion cost per lateral foot in the Delaware, and the $1.0mm per-well reduction in acquired Williston wells. · Open the full presentation →p. 25 — Four successive 2025 guidance revisions: capital down $400mm while oil production went up — the capital efficiency claim. · Open the full presentation →p. 28 — The debt maturity ladder and the $2.5bn reduction program, with ~70% of obligations falling after 2030. · Open the full presentation →p. 29 — Delaware inventory locations by operator — where Devon sat on the depth ranking before adding Coterra's acreage. · Open the full presentation →p. 30 — Emissions record and targets, including net-zero Scope 1 and 2 by 2050 and the 2030 methane and flaring goals. · Open the full presentation →
Q4 2025 Earnings Presentation — Q4 2025 · 14 pages · The full-year 2025 scorecard for standalone Devon, plus well productivity against ten named peers and the buyback record. · Open →
Q3 2025 Earnings Presentation — Q3 2025 · 14 pages · The preliminary 2026 plan Devon set before the Coterra deal — the standalone baseline the merger is measured against. · Open →
Q1 2025 Earnings Presentation — Q1 2025 · 17 pages · Where the $1bn business optimization plan was introduced, with the original category targets and timing. · Open →
Q4 2024 Earnings Presentation — Q4 2024 · 19 pages · The 2025 operating plan and a rarely repeated slide on Devon's gas marketing outlets and pricing exposure. · Open →
Q3 2024 Earnings Presentation — Q3 2024 · 16 pages · What the Grayson Mill acquisition did to the Williston business, side by side with the legacy position. · Open →
Q4 2023 Earnings Presentation — Q4 2023 · 25 pages · The pre-acquisition, pre-merger Devon: 2023 ROCE, the original 2024 plan and the capital efficiency benchmarking. · Open →