Competitors
Competitors describe Devon Energy Corporation's market in their own filings and calls. These verified passages and visual pages show where their strategies meet, using source documents preserved in Sources.
ConocoPhillips (COP)
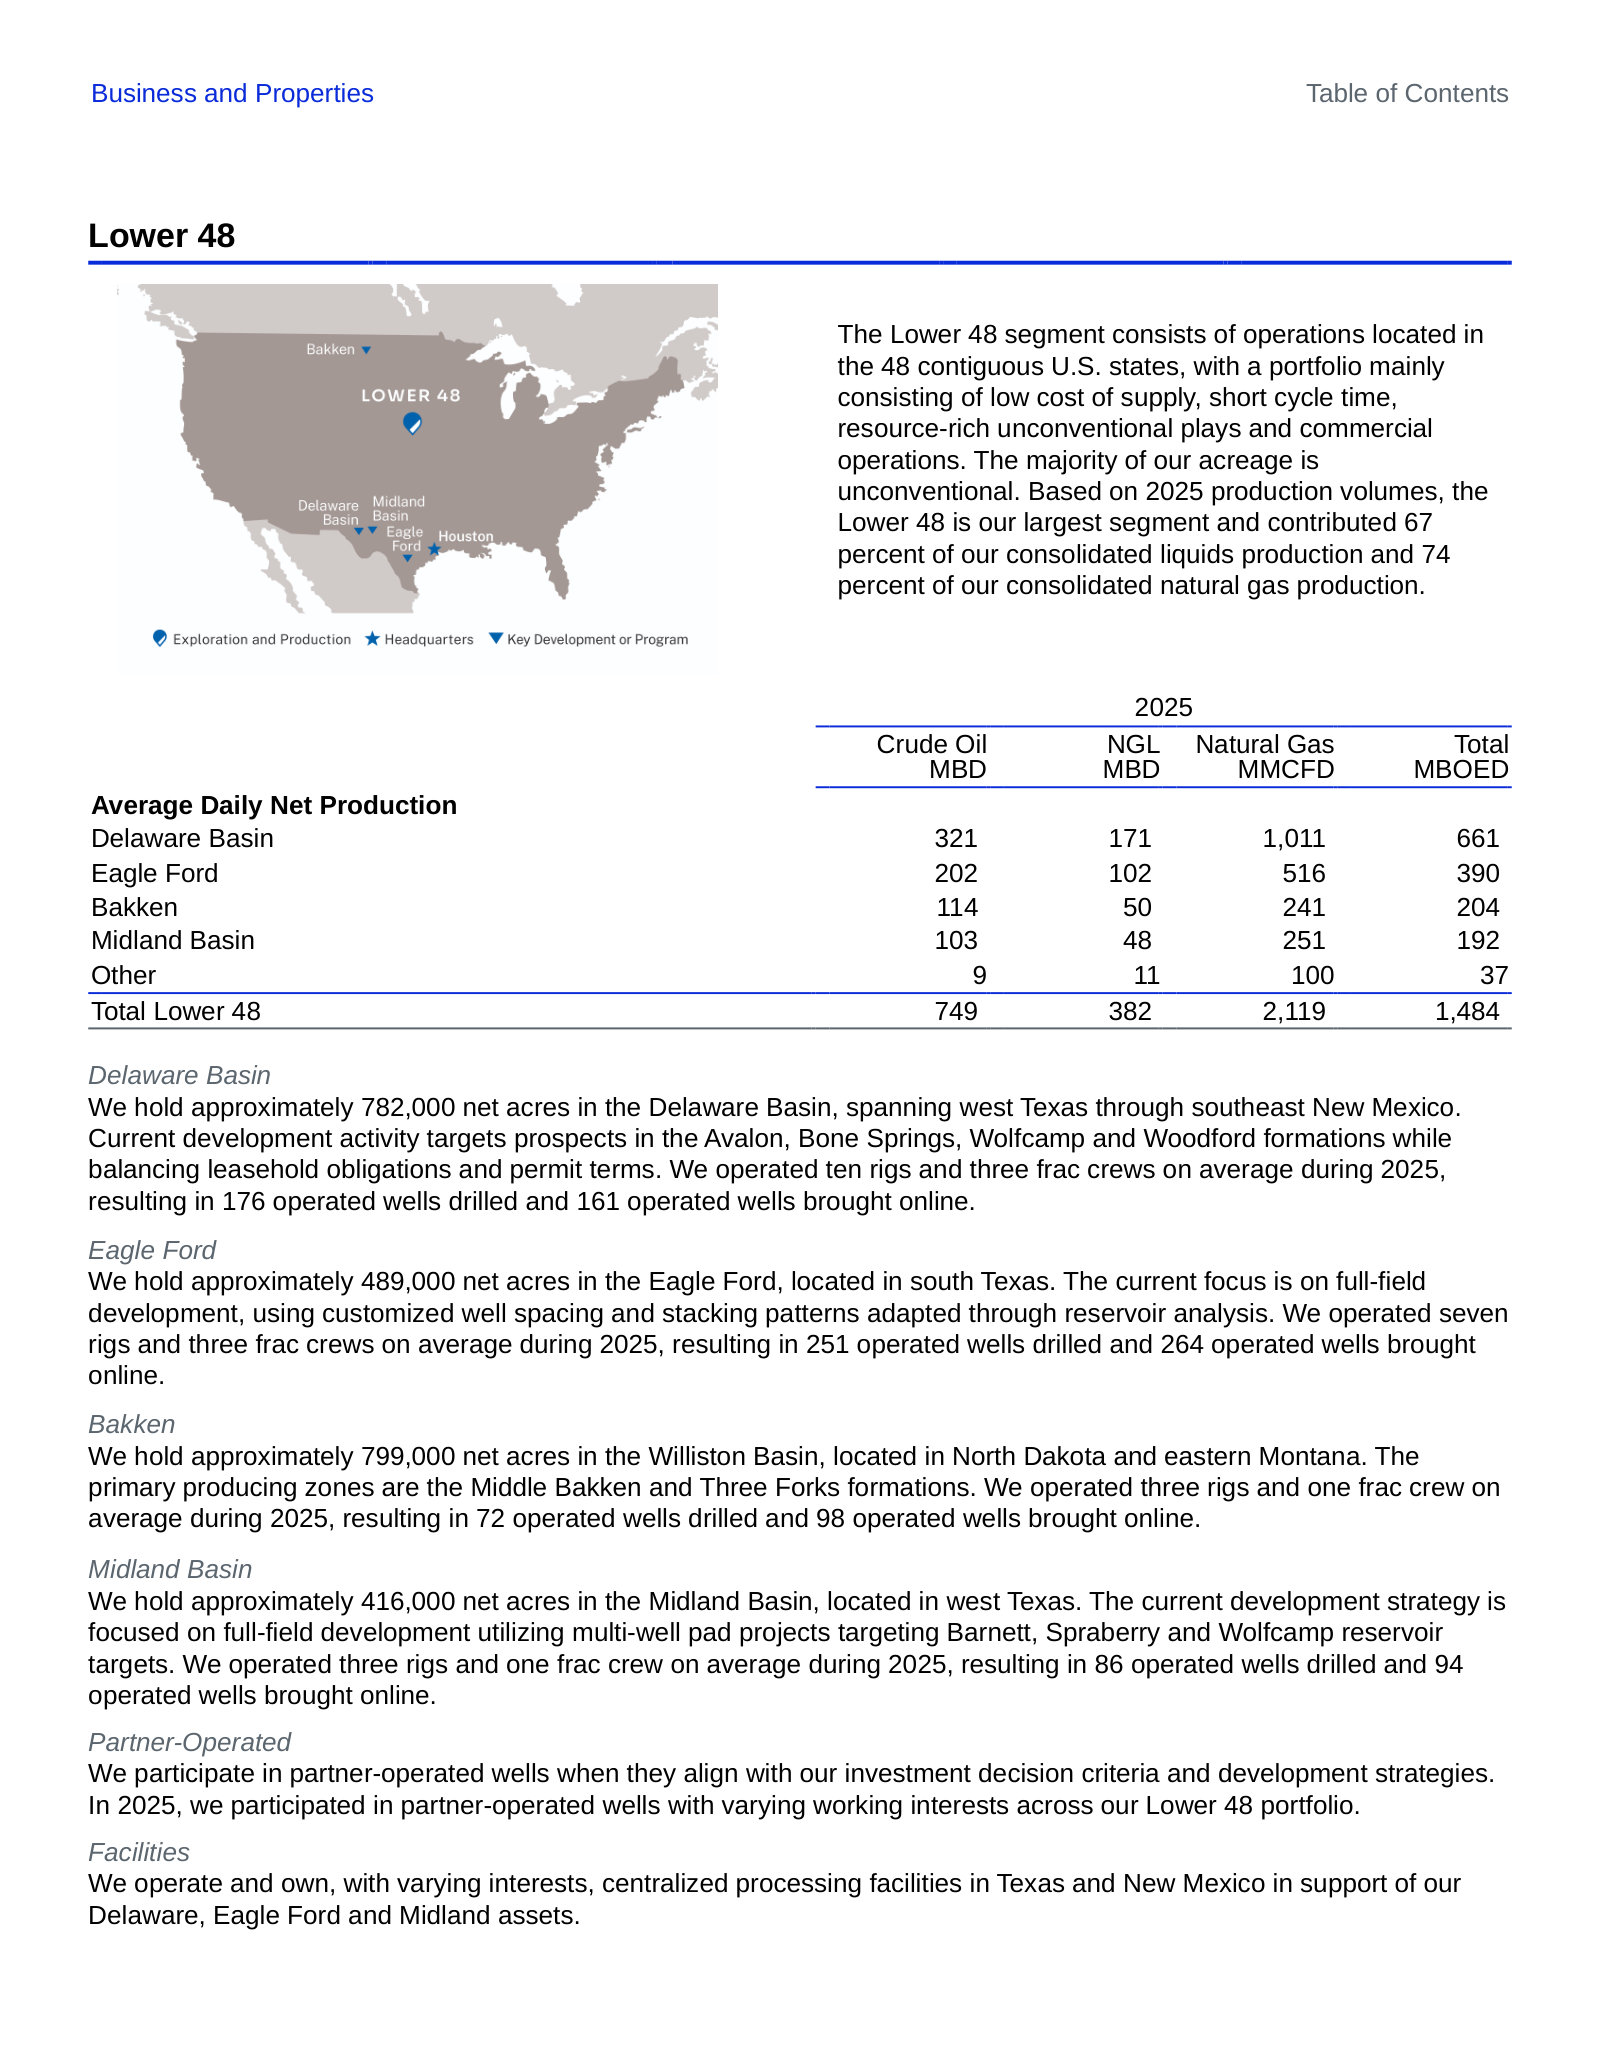
The largest operator in the Lower 48 and the peer whose asset map overlaps Devon's almost line for line: 782,000 net acres and 661 MBOED in the Delaware Basin, plus Eagle Ford, Bakken and Midland positions, and an Anadarko package it sold in 2025. It is also the loudest voice arguing that U.S. shale is splitting into inventory "haves and have-nots" — the frame every mid-cap, Devon included, is being sorted by. Exhibits are confined to the Lower 48 shale business; Alaska/Willow, Qatar and Canadian LNG commentary is left out.
A rare public cost-of-supply number for the basin that is Devon's largest asset. Answering Citi, COP's head of Lower 48 puts new Delaware Basin development at a low-to-mid $30s cost of supply and Eagle Ford refracs in the mid-to-upper $30s, a $2–$5 gap. "Cost of supply" is ConocoPhillips' internal metric — a WTI breakeven that includes capital, operating cost and its own hurdle return — so it is not directly comparable to a peer's quoted breakeven unless the definitions are matched, and it reflects COP's specific acreage and scale, not the basin average. Read as a benchmark rather than a market price: it is the level a competitor with 782,000 Delaware net acres says it is drilling at today.
Analyst (Citi) and Nicholas G. Olds (Executive Vice President, Lower 48): I wonder if I can get you to talk about the attractiveness of incremental capital in the Delaware versus refrac opportunities in the Eagle Ford. How would you compare and contrast those? […] If you look at the Delaware and Eagle Ford, they are quite different. On refracs in the Eagle Ford, we typically do 50 or 60 in a year. You can execute one for about 60% of a development well’s cost and get roughly a 60% uplift on that original completion on your EUR. In that case, you are looking at mid-$30 cost of supply—upper $30s for refracs. In the Delaware, which is some of our lower cost of supply, you are executing currently in the low to mid-$30s. Overall, Delaware will have a stronger return than a refrac, but they are very close—we are talking probably $2 to $5 difference in cost of supply. Both are very competitive in the portfolio.
p. 11 · Read in context →
Permian Resources Corporation (PR)
The purest head-to-head competitor Devon has in its core asset: a Delaware Basin-only operator with roughly 480,000 net leasehold acres in West Texas and New Mexico, drilling the same Bone Spring and Wolfcamp intervals in the same counties. It competes with Devon twice over — for barrels and for acreage, since it describes itself as the natural buyer of Delaware assets that come to market. Exhibits are confined to Delaware Basin cost, strategy and A&D commentary.
Goldman asks Permian Resources directly whether it is a consolidator or a seller, and the co-CEO answers on the record: "given our leading cost structure, we've always seen Permian Resources as the logical consolidator of Delaware Basin assets today." This is the exhibit that matters most for Devon's acquisition pipeline rather than its production — it is a competing bidder stating that it intends to be the buyer of Delaware packages, and citing a cost advantage as the reason it can pay more for the same rock. Management also names its recent deals (Barilla Draw, the Apache bolt-on) and, in the same answer, leaves the door open to selling the company, so the statement is a positioning claim rather than a commitment.
Neil Singhvi Mehta (Analyst, Goldman Sachs) and James H. Walter (Co-CEO): There's been a lot of talk about mergers and acquisitions in some of the larger cap conference calls, and I’d like your perspective. You have effectively consolidated assets with strategic bolt-ons and transformative mergers and acquisitions. Do you see Permian Resources as a consolidator or potentially as a seller in the future? I understand it's a complex question, but I believe it's an important one. […] No, that's a fair question and a good one. I think given our leading cost structure, we've always seen Permian Resources as the logical consolidator of Delaware Basin assets today. Frankly, we're really excited about that opportunity set and what's in front of us. We talked about it, but our ground game efforts remain strong. We continue to find larger scale acquisitions like the Barilla Draw acquisition last year, the Apache bolt-on earlier this year, and several hundred million dollar deals in between. We're confident that our pipeline remains robust, and we'll be able to find those types of attractive acquisitions that enhance our business. While we don't have a perfect crystal ball, I would say we're really excited about the opportunities available as a consolidator in the Delaware.
p. 5 · Read in context →
Diamondback Energy, Inc. (FANG)
The Permian scale peer that anchors the inventory-depth and cost-curve debate Devon is priced against. Its acreage is Midland-weighted (about 775,000 of 869,000 Permian net acres) rather than Delaware, so the direct rock overlap is smaller than PR's, but it competes with Devon for the same Permian services, the same private acreage packages and the same investor dollar, and its management is the most explicit in the group about where U.S. shale productivity is heading. Exhibits are limited to Permian inventory, cost and macro commentary; Viper minerals and midstream discussion is left out.
Diamondback's stated rationale for moving to growth in Q1 2026 — adding two to three rigs and a fifth completion crew into an oil supply disruption. The competitive claim is the second half: "the best inventory quality and depth in North America, executed at the best cost structure." That is management's own characterisation with no peer comparison or metric attached, and it is the same superlative several companies in this tab apply to themselves. What is checkable is the behaviour it justifies: a large Permian operator choosing to add activity rather than harvest the price, which is the supply response that determines whether the whole basin's service costs and realised prices hold.
Neil Singhvi Mehta (Analyst, Goldman Sachs) and Kaes Van't Hof (CEO): There are macro and micro elements. From a macro perspective, there is a clear market signal. We are two months into the world’s largest oil supply disruption in history, and while Diamondback Energy, Inc. is solely based in West Texas and somewhat of a tourist in this situation, it is a very serious event with a lot of oil supply off the market. If that is not a signal to grow production in an advantaged area like the Permian Basin, I do not know what is. […] On the micro, Diamondback Energy, Inc. has the best inventory quality and depth in North America, executed at the best cost structure. If this is not the time to grow now, then when?
p. 1 · Read in context →
Diamondback's view of the shape of the U.S. shale cost curve, and it is not a bullish one for the field as a whole: management says the cost curve is moving up, that efficiency gains are running into "geologic time," and that there are "signs of degradation in productive quality across the U.S." It holds its mid-cycle deck at mid-$60s WTI, mid-teens NGLs and $3 gas despite the price spike. The degradation claim is qualitative — no basin, vintage or productivity series is cited — and it is made by a company whose thesis depends on being at the low end of that rising curve, so it is self-serving as well as informative. The first paragraph is the frame it applies to itself and, by implication, to every operator ranked below it on inventory quality and depth.
Kaes Van't Hof (CEO) and Derrick Whitfield (Analyst, Texas Capital): The operator with the best inventory quality, lowest cost structure, and longest inventory depth has the right to grow organically and create shareholder value. We have been looking to hit the organic growth accelerator for a while but did not have macro support. […] Also, what are you seeing in degradation of inventory quality across the Permian, clearly beyond Diamondback Energy, Inc.?
Kaes Van't Hof (CEO):
We are long-term bullish. Within three months, we went from a projected largest oversupply (which was debatable) to the largest undersupply, and we are only two months in. It is hard for us to move off our mid-cycle framework—mid-$60s WTI, mid-teens NGLs, and $3 gas with Waha differentials. Energy security is becoming more important, meaning more landed storage and the U.S. barrel being more important than ever. We think the U.S. shale cost curve is moving up. Operators have done a good job with efficiencies, but geologic time catches up and there are signs of degradation in productive quality across the U.S. Our job is to keep Diamondback Energy, Inc. at the low end of the cost curve, with top-tier inventory depth and quality and low execution costs. We are very well positioned. It is too early to raise mid-cycle pricing.
p. 7 · Read in context →
BMO puts the "peak Permian" question to Diamondback directly — who has inventory to grow and who does not — against the company's disclosed claim of nearly two decades of inventory at its 2026 pace. Management does not convert that into a sustainable growth rate; it describes a "yellow light" posture in which oil production is the input and capital flexes around it, and points to the Barnett as an addition to inventory duration rather than near-term volume. The two-decade figure is Diamondback's own inventory count at its own pace and location assumptions, which is exactly the kind of number that is not comparable across operators. The exchange is useful mainly as evidence of how the sell side is now scoring Permian operators — on years of inventory, not on production.
Phillip Jungwirth (Analyst, BMO) and Kaes Van't Hof (CEO): And then you called out Diamondback having nearly 2 decades of inventory at its 2026 pace. Last year, there was a lot of talk about peak Permian, who has inventory to grow, who doesn't. But for Diamondback, assuming a green light scenario, just how do you think about a sustainable growth rate that can be achieved for the company over a multiyear period given the depth of resource you have? […] Yes. I mean, listen, I think it's highly dependent on the macro. But in general, it feels like investors over time want some form of growth. Now we've done it on a per-share basis for the last few years. At some point, organic growth is going to come into the equation. Unfortunately, we're still stuck in this yellow light and this stoplight analogy that we can't shake yet. But I think there's probably a world where if we can efficiently allocate capital and growth becomes the output, that's probably a good decision. I think for 2026, we're starting the year here still in this kind of quasi-yellow light where oil production is the input and then CapEx will be reduced if things go well and held steady if things go as planned. But it could be a world where we hold CapEx flat and see what growth comes out of it. But that day is not today. But there will be a time, and that's why every day, we think about inventory, inventory duration, inventory growth and things like the Barnett, which is getting a lot of airtime today, are accretive to that long-term duration story.
p. 5 · Read in context →
Expand Energy Corporation (EXE)
The largest independent natural gas producer in the U.S. by net daily production, and Devon's most significant new competitor after the Coterra merger brought a Marcellus position in Northeast Pennsylvania into the portfolio. Expand operates in the same Northeast PA window and is contracting the same PJM power and LNG demand Devon's gas would serve. Exhibits cover its gas market sizing, its Appalachian positioning and its supply contracting; Haynesville-only operational detail and Western Haynesville appraisal commentary is left out except where it frames the market.
A competitor sizing the gas market Devon's Marcellus barrels now sell into. Three claims to separate: the demand thesis (AI power, industrial reshoring, LNG), a specific Appalachian number — Northeast demand growth of 4 to 6 Bcf per day, which management ties to unlocking pipeline-constrained production — and a share claim, that per third-party reports Expand owns 72% of the lowest-breakeven inventory in the Haynesville. The 72% figure is a share of a sub-set defined by an unnamed third party's breakeven cut, not a share of the basin, and the 4–6 Bcf/d is a company forecast with no date attached. The structural point stands on its own: the operator arguing loudest that Northeast gas is takeaway-constrained is also the one positioned to benefit if in-basin demand, not new pipe, is what clears it.
Michael Wichterich (President and Chief Executive Officer): There is no disputing our industry is in the midst of a major demand growth. The big 3 drivers of demand, AI power, the reshoring of heavy industry and global LNG growth are converging to make the future bright for natural gas. All of this was happening even before the recent events of the Middle East. So now in addition to structural demand growth, energy security has pushed U.S. natural gas to the forefront. Expand is uniquely positioned to take advantage of these events. Simply put, we have positioned ourselves to be in the right place at the right time. For example, our Gulf Coast assets sit at the epicenter of LNG. In fact, our largest customers today are LNG facilities, and there is an increasing recognition of the strength and competitive advantage of our Haynesville position. According to third-party reports, today, we own 72% of the lowest breakeven inventory in the basin, allowing us to deliver certified natural gas directly to LNG facilities with minimal risk of basis blowouts. Fundamentally, we see LNG as a natural extension of our business. Demand in the region is not just LNG; AI-driven power and industrial demand is rapidly growing in the region. When you combine structural demand growth and energy security, we believe the Gulf Coast is well positioned to become a premium price market. Our Appalachia assets sit at the core of AI power demand. We believe the Northeast will soon see demand growth of 4 to 6 Bcf per day. In-basin demand growth will unlock pipeline-constrained production. We're also seeing a renewed optimism to build infrastructure to serve more Americans in the Northeast and Southeast markets. In-basin demand growth, combined with new infrastructure, will unleash our low-cost inventory and create substantial value for both Expand and our shareholders.
p. 1 · Read in context →
Expand's own statement of scale and market reach, from the same prepared remarks. Two claims: that it is the largest natural gas producer in North America — its 10-K makes the narrower and more defensible version, largest independent U.S. producer by net daily production — and that "nearly 90% of expected U.S. demand growth can be served by our assets." The 90% is a statement about geographic proximity of its Haynesville and Appalachian acreage to expected demand centres, not about contracted volumes or won business, and no source or demand forecast is given. The argument management builds on it is the commercially relevant one for any competing gas seller: that counterparties signing 15- and 20-year supply agreements will select on producer scale, inventory depth and balance sheet, which is a barrier a smaller Marcellus position has to answer.
Michael Wichterich (President and Chief Executive Officer): We have no doubt that Expand is built for this moment. Why? We're the largest natural gas producer in North America. Counterparties want to do business with someone who's going to be around for the next 20 years. The depth of our portfolio, combined with our investment-grade balance sheet, provide that confidence. We are in the right place at the right time. Nearly 90% of expected U.S. demand growth can be served by our assets. Lastly, we have a team that can execute. We reset the economics of our Haynesville position last year. And today, we continue to see opportunities to strike more value from every dollar of capital we deploy across our portfolio.
p. 2 · Read in context →
The most direct exchange in this tab about the acreage Devon acquired with Coterra. BMO frames it plainly — Expand is dominant in the Haynesville "but there's certainly larger competitors up there in Appalachia" — and management answers by splitting the basin: Northeast PA, where it says it is dominant and is in active negotiations with PJM power providers, versus Southwest Appalachia, where it concedes "some of our other competitors are further east" and positions itself only on the western side. Both the dominance claim and the geographic split are management's own; no production or acreage share is offered. What it establishes is that the Northeast PA power-supply contracts are being competed for now, by a counterparty with materially more gas to sell.
Phillip Jungwirth (Analyst, BMO Capital Markets) and Michael Wichterich (President and Chief Executive Officer): And then can you talk about what kind of role you see Expand playing i the Northeast for new power demand projects? I mean you clearly have the dominant position in the Haynesville, but there's certainly larger competitors up there in Appalachia. So just how do you see the opportunities for Expand here versus the Gulf Coast considering the different competitive dynamics? […] In general, when I think about the Appalachia, I think about it in two buckets because we have Northeast PA, where we actually are dominant in that particular area, and that's where our competitive advantage is on power generation, which is actually PJM, and that's the right market for it. And so we're definitely in negotiations and discussions with power providers in that area in particular. And again, we feel like we have a competitive advantage there. In Southwest Appalachia, location to the western side of that, we think we can be competitive on that side of the basin as some of our other competitors are further east. But the overall strategy is to focus on where we're the best. And so we're thinking about Northeast PA in that market.
p. 10 · Read in context →
EOG Resources, Inc. (EOG)
The multi-basin analog closest to Devon's shape after the Coterra merger: a Delaware Basin core, a large Eagle Ford position, and a deliberately built gas business (Utica, Dorado) aimed at the same LNG and power demand. It competes for the same Delaware and Eagle Ford acreage and, unlike the Permian pure-plays, argues that organic exploration rather than M&A is the cheaper way to add inventory — the direct alternative to the route Devon took. Exhibits exclude its international exploration (UAE, Bahrain, Trinidad) commentary.
EOG's sizing of the U.S. gas market and of its own resource base, from the Q1 2026 call. The market number is the transferable one: U.S. natural gas demand growing at a 3% to 5% compound annual rate through the end of the decade, driven by LNG feed gas and electricity load — a company forecast, offered without a source, but close to what Expand and Diamondback describe independently in this tab. The resource claim is EOG's own and rests on its assumptions: approximately 12 billion barrels of oil equivalent of resource potential generating better than a 100% direct after-tax rate of return at $55 WTI and $3 Henry Hub. "Resource potential" is not proved reserves and "direct after-tax return" excludes overhead and capitalised costs, so the figure is not comparable to a peer's reserve or inventory disclosure without restating both.
Ezra Y. Yacob (Chairman and Chief Executive Officer): On natural gas, nearterm pressure remains with Lower 48 storage levels above the five-year average. However, our medium- to long-term outlook remains positive. U.S. natural gas benefits from two durable structural tailwinds: rising LNG feed gas demand and increasing electricity consumption. We expect U.S. natural gas demand to grow at a 3% to 5% compound annual growth rate through the end of the decade and believe the previously forecasted potential for global LNG oversupply has been significantly reduced with the damage to LNG infrastructure abroad. Our investments in building a premium gas position to complement our oil business have us well positioned to supply these expanding markets. […] First, we have a high-return domestic and international asset base with deep, long-duration inventory. Across our multi-basin portfolio, we estimate approximately 12 billion barrels of oil equivalent of resource potential generating greater than a 100% direct after-tax rate of return at $55 WTI and $3 Henry Hub. Our disciplined capital investment allows us to pace development appropriately and direct capital towards the highest-return opportunities across the portfolio.
p. 2 · Read in context →
Where EOG says it is putting 2026 capital: the Delaware Basin, the Utica and the Eagle Ford, with more activity at Dorado. The half-sentence worth noticing is the Delaware one — "after adjusting our development strategy in 2025, we expect consistent well performance year over year" — an oblique reference to the spacing and co-development changes EOG made after weaker Delaware results, and a reminder that even the lowest-cost operators are still resetting how densely the same intervals Devon drills can be developed. The three-year scenario attached to it is EOG's own model: $55–$70 WTI, 5% cash flow and better than 6% free cash flow CAGR, and $10–$18 billion cumulative free cash flow through 2028.
Ezra Y. Yacob (CEO): Looking ahead, we have a disciplined plan for 2026. Our strategy prioritizes activity in the Delaware Basin, the Utica, and the Eagle Ford, while increasing activity in Dorado alongside continued international investment. Our Utica asset provides a compelling opportunity for value creation as we continue to identify additional upside from the Encino acquisition as well as advancing our technical understanding of the play. And in the Delaware Basin, after adjusting our development strategy in 2025, we expect consistent well performance year over year. […] Using WTI price ranges of $55 to $70 per barrel from 2026 through 2028, the updated three-year scenario delivers 5% cash flow and greater than 6% free cash flow compound annual growth rates, generating cumulative free cash flow of $10 billion to $18 billion and earning robust double-digit returns on capital employed.
p. 2 · Read in context →
Ovintiv Inc. (OVV)
The peer that ran the opposite portfolio play to Devon's over the same window: it sold its Anadarko Basin assets — a basin Devon still operates — and concentrated on the Permian and the Montney, while Devon added Marcellus gas and Permian scale through Coterra. Its Midland Basin position competes with Devon for the same private acreage packages, and its commentary is the most specific in this tab on what shale inventory is actually changing hands for. Canadian Montney operating detail is excluded except where it frames the portfolio choice.
Ovintiv's account of finishing a portfolio transformation into two basins, and the market claim underneath it: that roughly 80% of the remaining sub-$50 breakeven oil locations in North America sit in the Permian and the Montney. That is a whole-continent inventory statement made by a company that owns positions in exactly those two plays, with no source, breakeven convention or location-count methodology disclosed — treat it as a thesis, not a measurement. The checkable operational claim beside it is more useful: more than 3,200 Permian and Montney drilling locations added since 2023 at an average $1.4 million per net 10,000-foot location, without equity issuance. The closing paragraph is the same haves-and-have-nots argument ConocoPhillips makes, restated from a mid-cap position.
Brendan McCracken (President and CEO): Several years ago, we made the strategic decision to focus our portfolio and build highquality inventory depth in the Permian and the Montney. Approximately 80% of the remaining sub-$50 breakeven oil locations in North America are located in those two basins, bolstering our positions in these plays, where we have competitive advantage, means we can continue to deliver durable returns for many years to come. Since 2023, we've increased our Permian and Montney drilling inventory by more than 3,200 locations at an average cost of $1.4 million per net 10,000-foot locations, and we did it without diluting our shareholders or stressing our balance sheet. This inventory life expansion has been unmatched by our peers and leaves us with one of the most valuable inventory positions in the industry. […] As North American shale continues to mature, a very clear competitive advantage is emerging for companies like ours, that have already set their inventory position up for success, have a clean balance sheet and can access premium price markets and have a demonstrated track record that translates to leading edge efficiency and returns. That combination of attributes is truly differentiated.
p. 1 · Read in context →
More peer documents
Expand Energy — Q3 FY2025 earnings call — Q3 FY2025 · 13 pages · Page 2 walks through Expand's new demand-by-submarket slide and the Lake Charles Methanol deal — a 15-year gas supply contract won on depth of inventory, delivery scale and carbon intensity, which is the template for how long-dated demand is being locked up. · Open →
Expand Energy — FY2025 Form 10-K — FY2025 · 184 pages · Carries the audited version of the scale claim — "largest independent natural gas producer in the U.S., based on net daily production" — plus the developed/undeveloped acreage table by operating area, which is the way to size the Northeast Appalachia position against Devon's Marcellus. · Open →
Diamondback Energy — FY2025 Form 10-K — FY2025 · 239 pages · States the Permian acreage split precisely — approximately 869,036 net acres, of which 774,645 Midland and 94,391 Delaware — which is the check on how much of Diamondback's claimed inventory depth actually overlaps Devon's Delaware core. · Open →
Permian Resources — FY2025 Form 10-K — FY2025 · 157 pages · Gives the acreage behind the cost-leadership claims: roughly 480,000 net leasehold acres and over 105,000 net royalty acres, 67% Texas and 33% New Mexico, plus the Apache bolt-on terms and the schedule of acreage expiring over five years. · Open →
EOG Resources — FY2025 Form 10-K — FY2025 · 169 pages · Sets out the play-by-play acreage that EOG's exploration-over-M&A argument rests on — about 1.1 million net acres in the Utica including the 675,000 core acres from Encino, 565,000 in the Eagle Ford and 160,000 in Dorado — and the 2025 net well counts by area. · Open →
Ovintiv — FY2025 Form 10-K — FY2025 · 177 pages · Documents the divestitures behind the two-basin story — roughly 360,000 net acres of Anadarko sold for $3.0 billion and about 126,000 net acres of Uinta — giving a per-acre read on what a mature liquids-rich basin position is worth today. · Open →