Full Report
The numbers behind Devon Energy Corporation: as-reported financial statements and company metrics for FY2021–FY2025, traced to the source filings, opened with the share-price history those statements have to justify. Every linked figure opens the exact page of the filing it was printed on, with the statement row highlighted. Amounts in US$ millions unless noted.
Reading notes: Display units are US$ millions, as printed on Devon's statements ('Millions, except per share amounts'). Per-share values and production KPIs are as printed. FY2021-FY2025 statement figures are each taken from that fiscal year's own Form 10-K (first, current-year column). FY2019 and FY2020 long-term figures are the comparative columns of the FY2021 Form 10-K. FY2016-FY2018 long-term figures come from the standardized SEC XBRL feed (data/financials/) and are shown without page links; total revenues and capital expenditures for those years are left blank because the feed values could not be reconciled to any reported caption (see discrepancies). Devon aggregates its U.S. operating segments into a single reportable segment (FY2025 Form 10-K, Note 20), so there is no segment-profit statement. The revenue breakdown instead uses Devon's own product disaggregation - oil, gas and NGL sales by commodity, marketing and midstream revenues, and the mark-to-market 'Oil, gas and NGL derivatives' line - which together foot exactly to the printed 'Total revenues'.
Share Price — Full Available History — 37 Years
The stock closed at $44.41 on Jul 29, 2026 — up 570% over the window shown (+5.3% a year), trading between $3.88 and $124.36. At that close the stock trades at 11× FY2025 diluted EPS as reported below.
Source: market price feed, monthly closes, sampled from 9,211 source observations, Jan 1990–Jul 2026. Price return only, excludes dividends.
Market capitalization $22.5bn and enterprise value $29.5bn.
Market cap = 507.0M shares outstanding × the Jul 29, 2026 close of $44.41. Enterprise value adds total debt of $8.4bn and subtracts cash and equivalents of $1.4bn (net debt of $7.0bn), from the FY2025 balance sheet. Market-derived figures, shown without filing links.
FY2025 at a Glance
Revenue (US$ millions)
Diluted EPS
Source: FY2025 consolidated statements [1] [2] [3] [4]. Click any linked figure to open the filing page with the row highlighted.
Revenue by Product
| Revenue by Product | FY2021 | FY2022 | FY2023 | FY2024 | FY2025 |
|---|---|---|---|---|---|
| Oil | 6,996 | 10,281 | 8,879 | 9,368 | 8,906 |
| Gas | 1,104 | 1,948 | 703 | 398 | 842 |
| NGL | 1,431 | 1,853 | 1,209 | 1,410 | 1,475 |
| Oil, gas and NGL sales | 9,531 | 14,082 | 10,791 | 11,176 | 11,223 |
| Marketing and midstream revenues | 4,219 | 5,745 | 4,349 | 4,743 | 5,563 |
| Oil, gas and NGL derivatives | (1,544) | (658) | 118 | 21 | 402 |
| Total revenues | 12,206 | 19,169 | 15,258 | 15,940 | 17,188 |
| Total revenues growth, derived | — | +57.0% | -20.4% | +4.5% | +7.8% |
Source: Form 10-K Note 1 - Disaggregation of Revenue (oil / gas / NGL sales) and Consolidated Statements of Comprehensive Earnings (marketing, derivatives, total) [5] [1] [6] [2]. Click any linked figure to open the filing page with the row highlighted.
Income Statement
Source: Consolidated Statements of Comprehensive Earnings [1] [2] [3] [4]. Click any linked figure to open the filing page with the row highlighted.
Columns marked E are consensus analyst estimates from S&P Capital IQ (CapIQ), shown alongside reported results for direct comparison; they are not company guidance.
Estimate source: S&P Capital IQ (CapIQ) consensus, as of 2026-07-30. Estimate figures are S&P Capital IQ consensus (vendor data — no filing page links). EPS and net income use the normalized (adjusted) consensus where the street reports it. Line-item analyst models (segments, drivers, KPIs) are in the Visible Alpha tab.
Balance Sheet
Source: Consolidated Balance Sheets [7] [8] [9] [10]. Click any linked figure to open the filing page with the row highlighted.
Cash Flow
Source: Consolidated Statements of Cash Flows [11] [12] [13] [14]. Click any linked figure to open the filing page with the row highlighted.
Realized Prices and Hedging
| Realized Prices and Hedging | FY2021 | FY2022 | FY2023 | FY2024 | FY2025 |
|---|---|---|---|---|---|
| Oil (per Bbl) | 65.98 | 94.11 | 75.98 | 73.78 | 62.77 |
| Natural gas (per Mcf) | 3.40 | 5.47 | 1.83 | 0.91 | 1.67 |
| NGLs (per Bbl) | 29.52 | 34.18 | 20.48 | 20.20 | 18.28 |
| Hedge cash settlements, total | (1,462) | (1,356) | 47 | 197 | 232 |
Source: company filings [15] [16] [17] [18]. Click any linked figure to open the filing page with the row highlighted.
Field-Level Cash Margin and Unit Costs
| Field-Level Cash Margin and Unit Costs | FY2021 | FY2022 | FY2023 | FY2024 | FY2025 |
|---|---|---|---|---|---|
| LOE per Boe | 4.12 | 4.81 | 5.95 | 5.83 | 6.27 |
| Gathering, processing transportation per Boe | 2.91 | 3.11 | 2.92 | 2.93 | 2.71 |
| DD A, oil and gas, per Boe | 9.83 | 9.52 | 10.27 | 11.70 | 11.35 |
| G A per Boe | 1.88 | 1.77 | 1.70 | 1.85 | 1.60 |
| Field-level cash margin per Boe | 35.47 | 50.65 | 32.76 | 29.63 | 24.97 |
| Field-level cash margin | 7,400 | 11,285 | 7,863 | 7,993 | 7,656 |
| EBITDAX | 5,605 | 9,586 | 7,534 | 7,739 | 7,413 |
Source: company filings [19] [20] [15] [21]. Click any linked figure to open the filing page with the row highlighted.
Proved Reserves and Resource Base
| Proved Reserves and Resource Base | FY2021 | FY2022 | FY2023 | FY2024 | FY2025 |
|---|---|---|---|---|---|
| Total proved reserves (MMBoe) | 1,625 | 1,815 | 1,817 | 2,155 | 2,428 |
| Proved developed reserves (MMBoe) | 1,285 | 1,419 | 1,425 | 1,715 | 1,844 |
| Proved undeveloped reserves (MMBoe) | 340 | 396 | 392 | 440 | 584 |
| Proved undeveloped share of total proved | 21% | 22% | 22% | 20% | 24% |
| Extensions and discoveries (MMBoe) | 228 | 278 | 322 | 340 | 443 |
| Standardized measure of discounted future net cash flows | 19,301 | 31,314 | 19,313 | 19,770 | 18,765 |
Source: company filings [22] [23] [24] [25]. Click any linked figure to open the filing page with the row highlighted.
Drilling Activity, Wells and Acreage
| Drilling Activity, Wells and Acreage | FY2021 | FY2022 | FY2023 | FY2024 | FY2025 |
|---|---|---|---|---|---|
| Net wells completed during the year | 255.1 | 311.1 | 335.9 | 338.0 | 336.6 |
| Net producing wells at year end | 4,708 | 5,667 | 5,811 | 7,158 | 7,329 |
| Total net acreage (thousands) | 1,946 | 2,012 | 2,028 | 2,370 | 2,369 |
| Net undeveloped acreage (thousands) | 1,281 | 1,282 | 1,285 | 1,316 | 1,310 |
Source: company filings [26] [16] [27] [18]. Click any linked figure to open the filing page with the row highlighted.
Capital Program and Shareholder Distributions
| Capital Program and Shareholder Distributions | FY2021 | FY2022 | FY2023 | FY2024 | FY2025 |
|---|---|---|---|---|---|
| Costs incurred in oil and gas activities | 11,253 | 5,167 | 3,759 | 8,553 | 4,000 |
| Shares repurchased during the year (millions) | 14.0 | 11.7 | 19.1 | 24.2 | 30.8 |
| Fourth-quarter dividend rate per share | 0.84 | 1.35 | 0.77 | 0.22 | 0.24 |
Source: company filings [28] [29] [30] [31]. Click any linked figure to open the filing page with the row highlighted.
Long-Term Record
| Fiscal year | Total revenues | Net earnings attributable to Devon | Diluted net earnings per share | Net cash from operating activities | Capital expenditures | Total stockholders' equity attributable to Devon |
|---|---|---|---|---|---|---|
| FY2016 | — | (1,056) | (2.09) | 1,500 | — | 8,274 |
| FY2017 | — | 898 | 1.70 | 2,909 | — | 9,254 |
| FY2018 | — | 3,064 | 6.10 | — | — | 9,186 |
| FY2019 | 6,220 | (355) | (0.89) | 2,043 | (1,910) | 5,802 |
| FY2020 | 4,828 | (2,680) | (7.12) | 1,464 | (1,153) | 2,885 |
| FY2021 | 12,206 | 2,813 | 4.19 | 4,899 | (1,989) | 9,262 |
| FY2022 | 19,169 | 6,015 | 9.12 | 8,530 | (2,542) | 11,167 |
| FY2023 | 15,258 | 3,747 | 5.84 | 6,544 | (3,883) | 12,061 |
| FY2024 | 15,940 | 2,891 | 4.56 | 6,600 | (3,645) | 14,496 |
| FY2025 | 17,188 | 2,642 | 4.17 | 6,711 | (3,592) | 15,528 |
Source: consolidated statements across filings; older years from the standardized feed [11] [7] [1] [12]. Click any linked figure to open the filing page with the row highlighted.
Operating KPIs
| KPI | FY2021 | FY2022 | FY2023 | FY2024 | FY2025 |
|---|---|---|---|---|---|
| Oil production (MBbls/d) | 290 | 299 | 320 | 347 | 389 |
| Natural gas production (MMcf/d) | 890 | 976 | 1,054 | 1,196 | 1,382 |
| NGL production (MBbls/d) | 133 | 149 | 162 | 191 | 221 |
| Total production (MBoe/d) | 572 | 610 | 658 | 737 | 840 |
| Realized price, unhedged (per Boe) | 45.68 | 63.20 | 44.96 | 41.44 | 36.60 |
Source: company-reported operating metrics [15] [32] [17] [33]. Click any linked figure to open the filing page with the row highlighted.
Analyst Consensus
Mean target
Median target
High target
Low target
Street ratings: 21 strong buy, 4 buy, 2 hold. Consensus: Strong Buy.
Estimate source: S&P Capital IQ (CapIQ) consensus, as of 2026-07-30. Estimate figures are S&P Capital IQ consensus (vendor data — no filing page links). EPS and net income use the normalized (adjusted) consensus where the street reports it. Line-item analyst models (segments, drivers, KPIs) are in the Visible Alpha tab.
Traceability
508 of 520 figures on this page (98%) link to the filing page where they are printed — click a linked figure to open the source PDF at that page with the row highlighted. Unlinked figures come from standardized data feeds or pre-filing years.
Display units are US$ millions, as printed on Devon's statements ('Millions, except per share amounts'). Per-share values and production KPIs are as printed.
FY2021-FY2025 statement figures are each taken from that fiscal year's own Form 10-K (first, current-year column). FY2019 and FY2020 long-term figures are the comparative columns of the FY2021 Form 10-K.
FY2016-FY2018 long-term figures come from the standardized SEC XBRL feed (data/financials/) and are shown without page links; total revenues and capital expenditures for those years are left blank because the feed values could not be reconciled to any reported caption (see discrepancies).
Devon aggregates its U.S. operating segments into a single reportable segment (FY2025 Form 10-K, Note 20), so there is no segment-profit statement. The revenue breakdown instead uses Devon's own product disaggregation - oil, gas and NGL sales by commodity, marketing and midstream revenues, and the mark-to-market 'Oil, gas and NGL derivatives' line - which together foot exactly to the printed 'Total revenues'.
Statement captions changed over the period and are quoted verbatim per year: the FY2021 and FY2022 Form 10-Ks print 'Earnings (loss) from continuing operations before income taxes', 'Income tax expense (benefit)', 'Net earnings (loss) attributable to Devon' and '- continuing operations' suffixes on the cash-flow subtotals (Barnett Shale and Canada were discontinued operations in 2019-2020). The tab uses the current captions as row labels.
The FY2021 balance sheet prints no short-term debt line (none outstanding at December 31, 2021), so that cell is blank; the Q1 FY26 balance sheet prints 'Total stockholders' equity' rather than 'Total equity' because the noncontrolling interest was bought in during Q3 2025.
The FY2021 Form 10-K reflects the January 7, 2021 WPX merger; the FY2024 balances and volumes reflect the Grayson Mill acquisition that closed in Q3 2024. Devon announced an all-stock merger with Coterra Energy on February 2, 2026 that closed in Q2 2026; the corpus ends at the Q1 FY2026 Form 10-Q, so every figure here is standalone Devon.
data/financials/*_quarterly.json carries no fourth-quarter rows, so the derived Q4 columns could not be cross-checked against the feed. They were instead checked against Devon's own fourth-quarter press releases: Q4 2024 net earnings of $639 million / $0.98 per diluted share and operating cash flow of $1.7 billion, and Q4 2025 net earnings of $562 million / $0.90 per diluted share, operating cash flow of $1.5 billion and $250 million of share repurchases - all matching the derived values.
5 figure(s) differed between the data feed and the filing; the filing value is shown (see the run's metrics/metrics_tab.json for the audit trail).
Devon Energy Corporation's management explains the business in its own materials. The slides below do the most of that work, pulled from the documents preserved in Sources. Each source link opens the complete presentation at that slide in a new tab.
Devon Mid-Year Update — June 2026
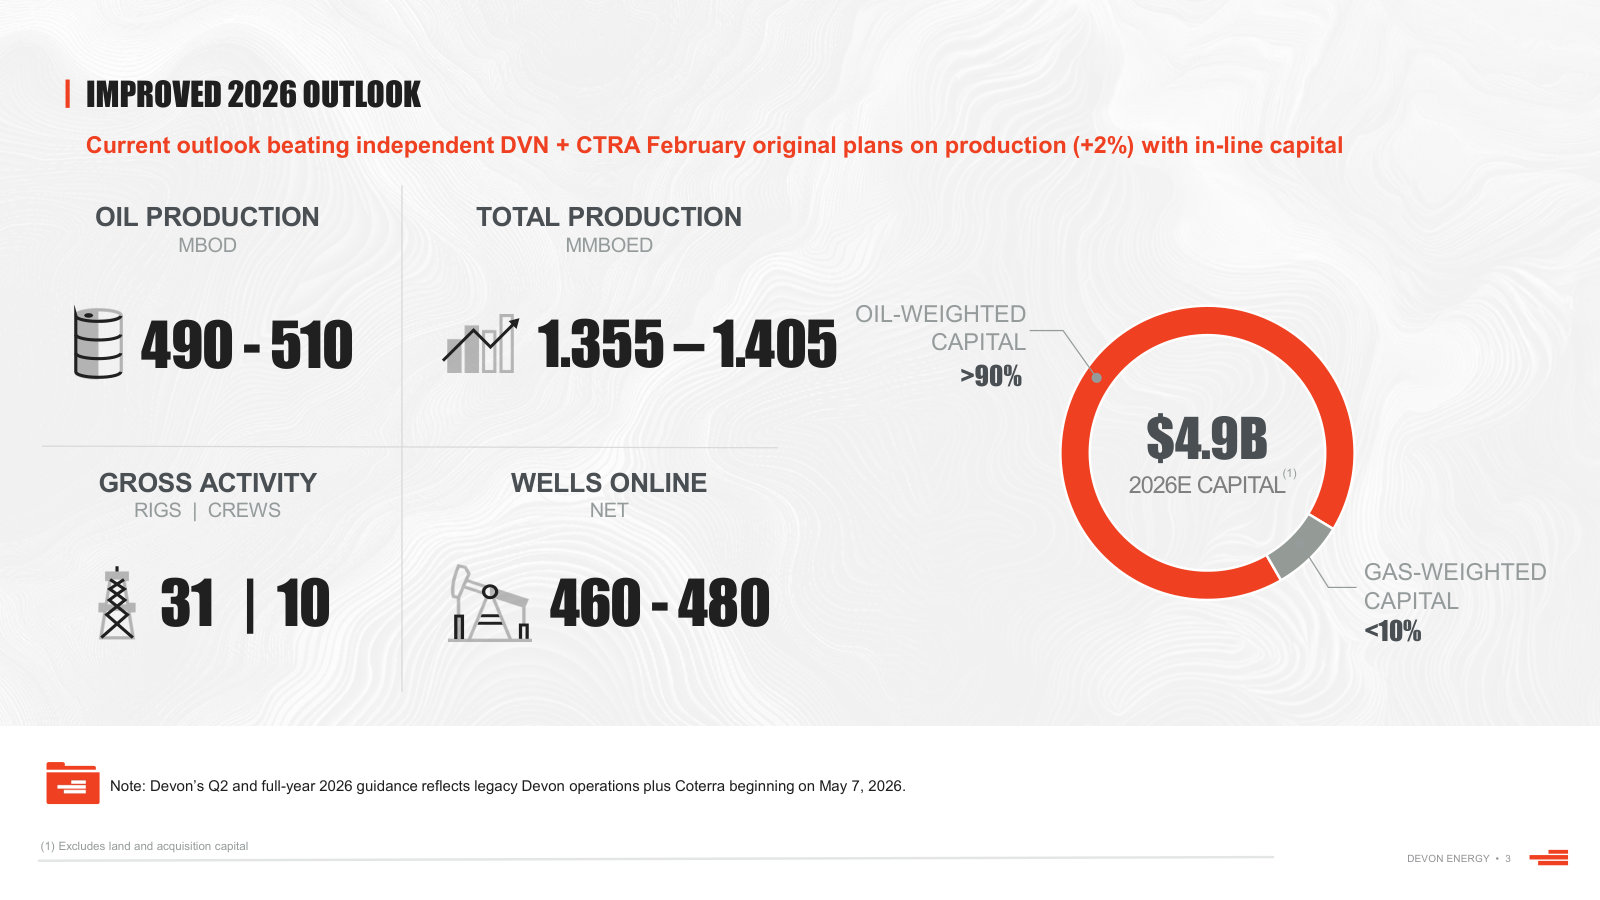
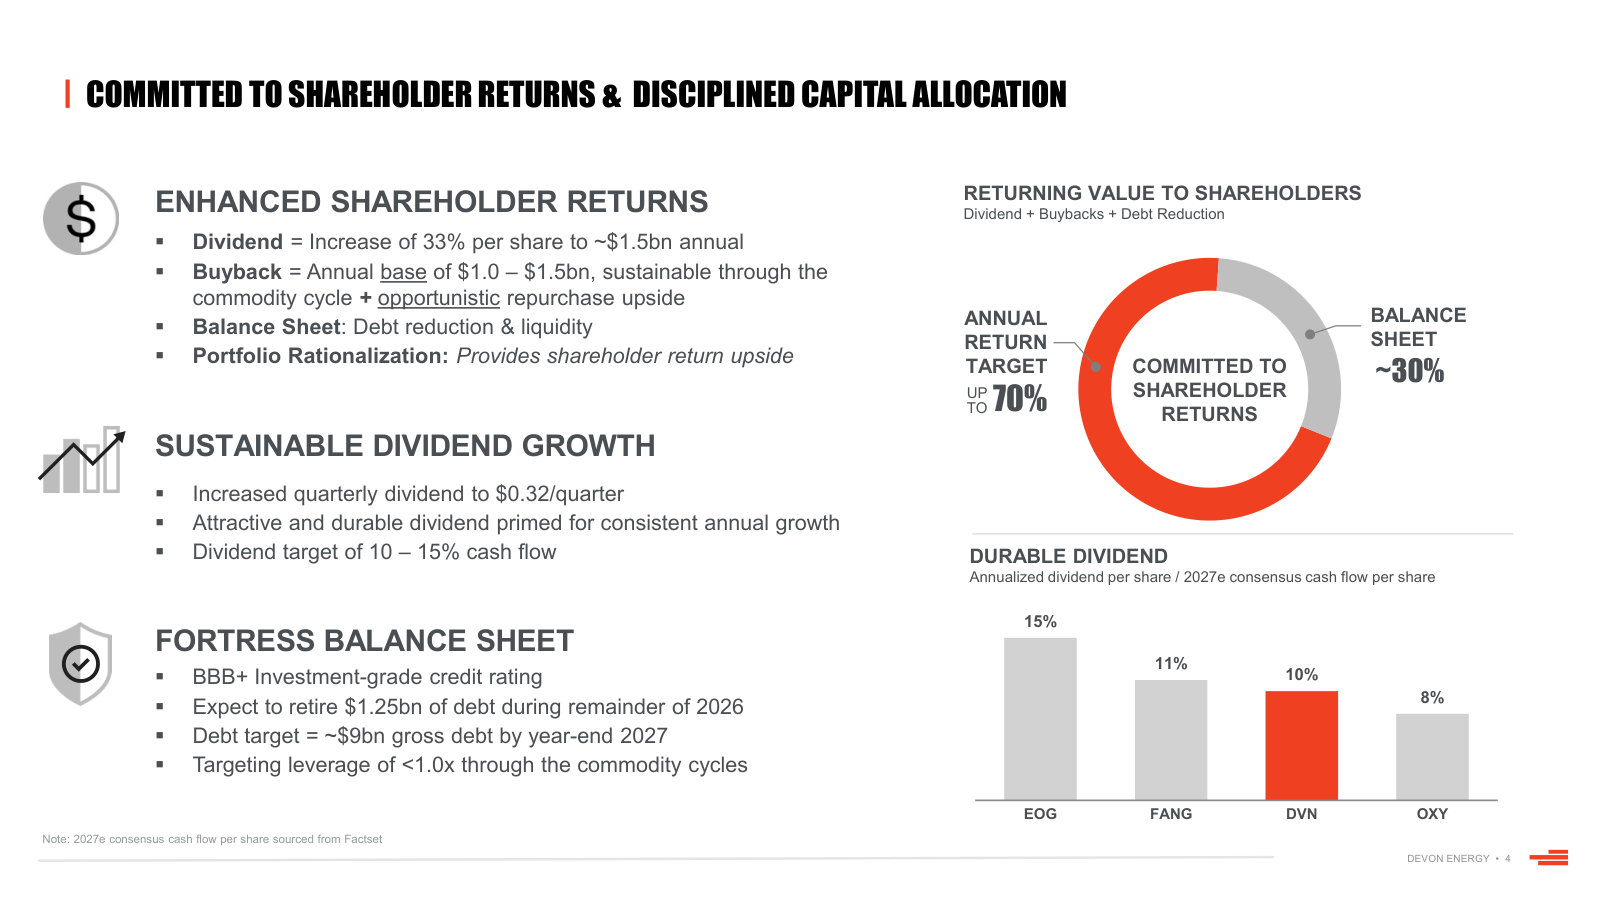
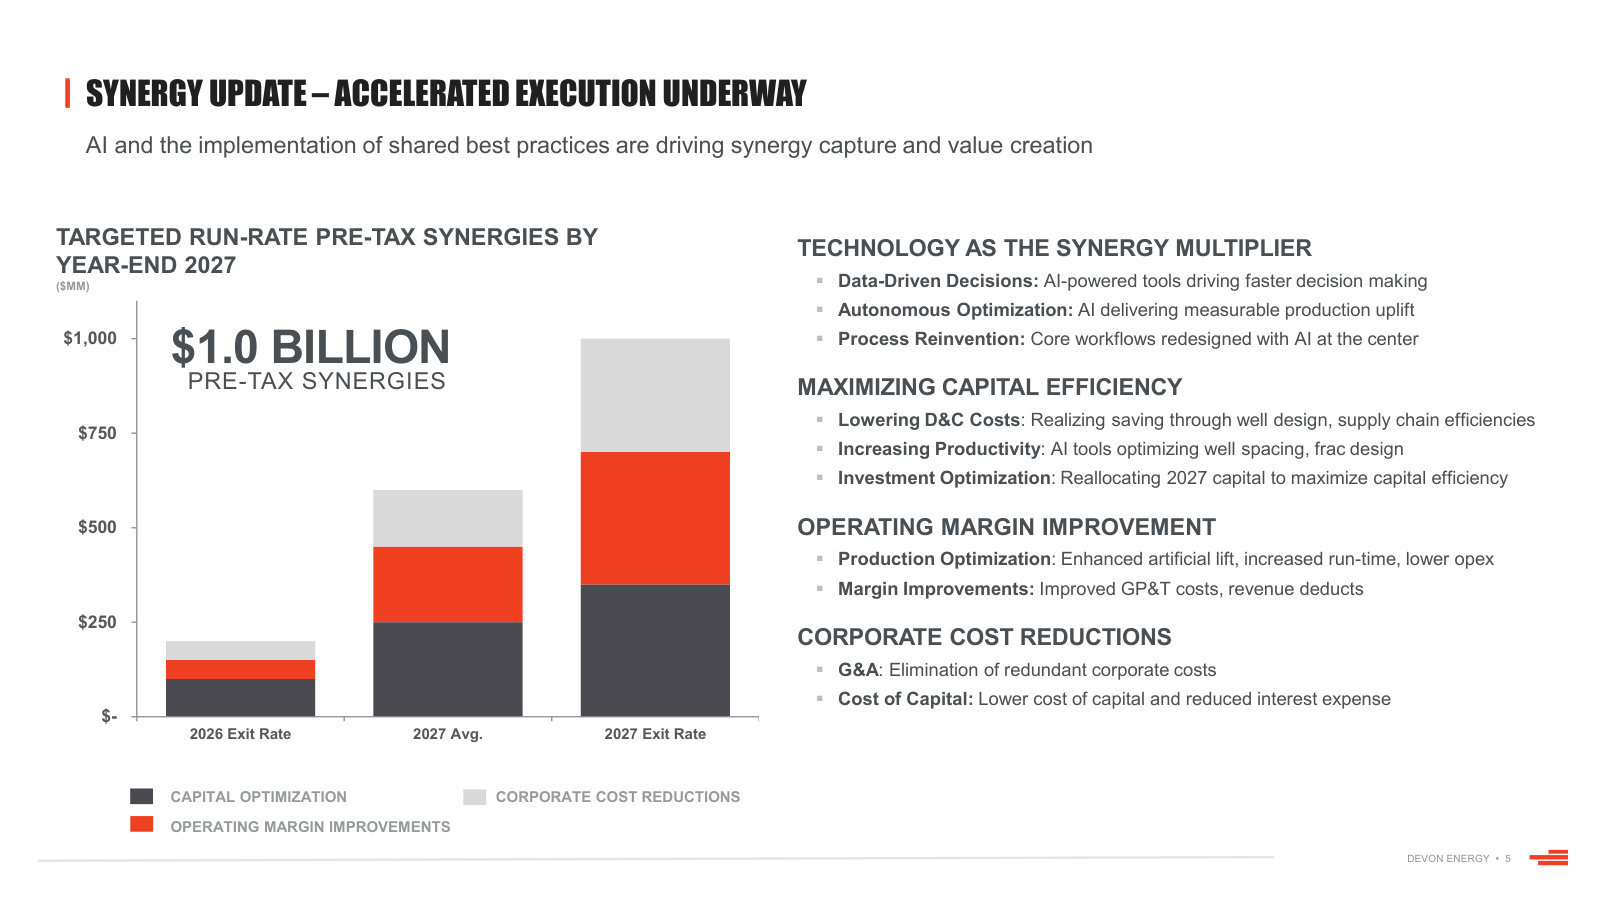
The first full statement of the combined Devon-Coterra company: guidance, capital allocation, synergy pace and portfolio direction. · Open the full document →
Q1 2026 Earnings Presentation — Q1 2026
The last standalone-Devon quarter, and the clearest account of the $1bn business optimization program and the asset-level deals around it. · Open the full document →
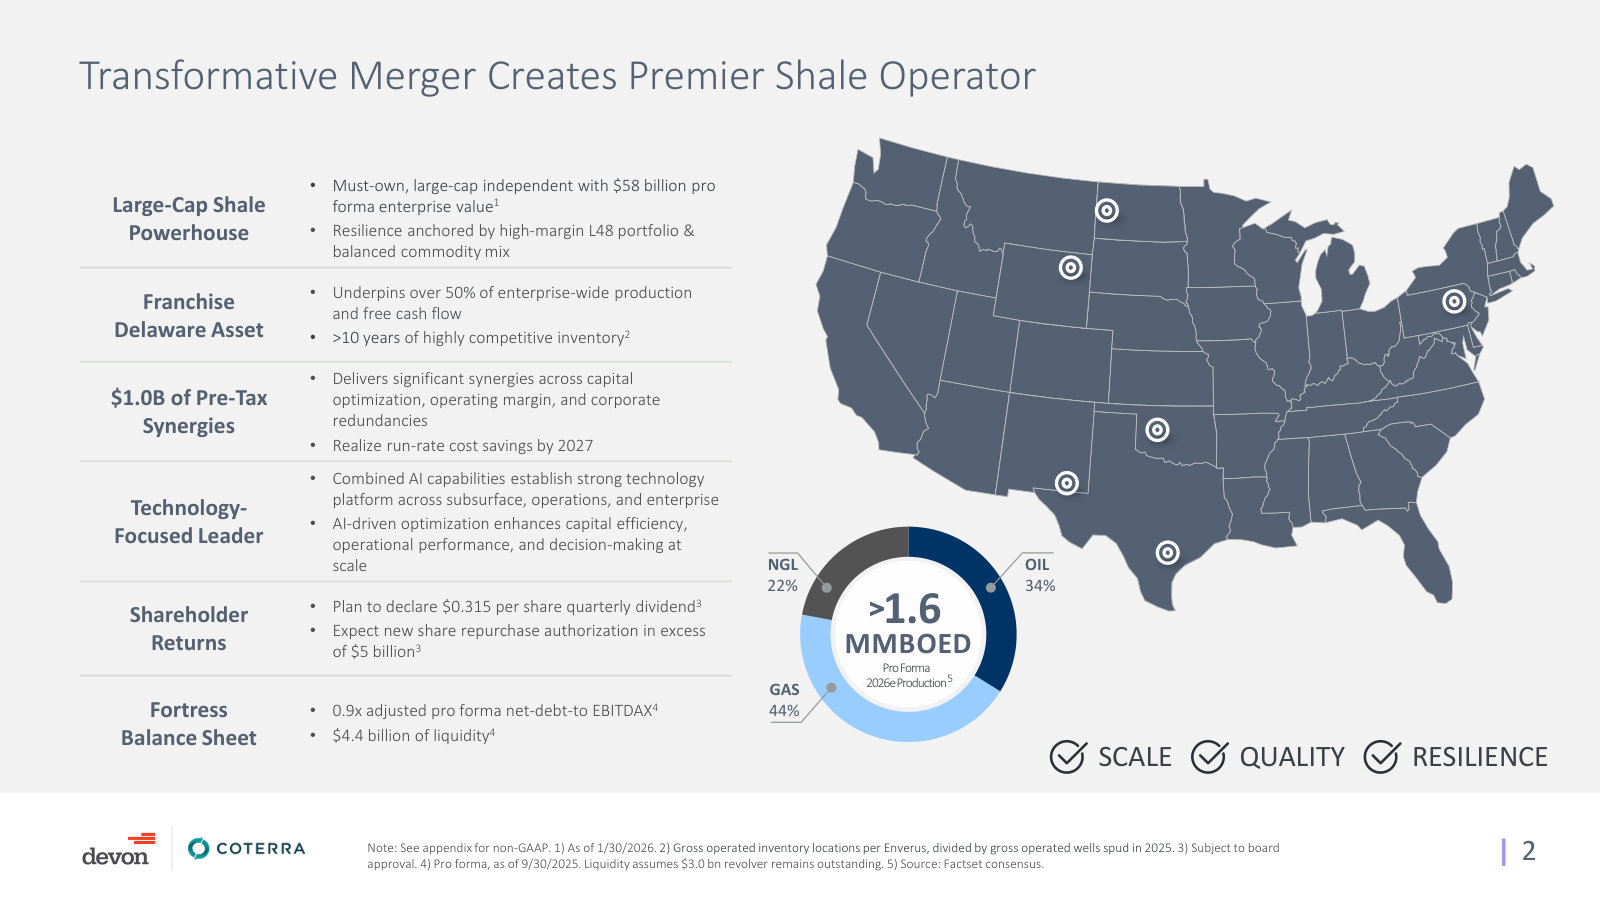
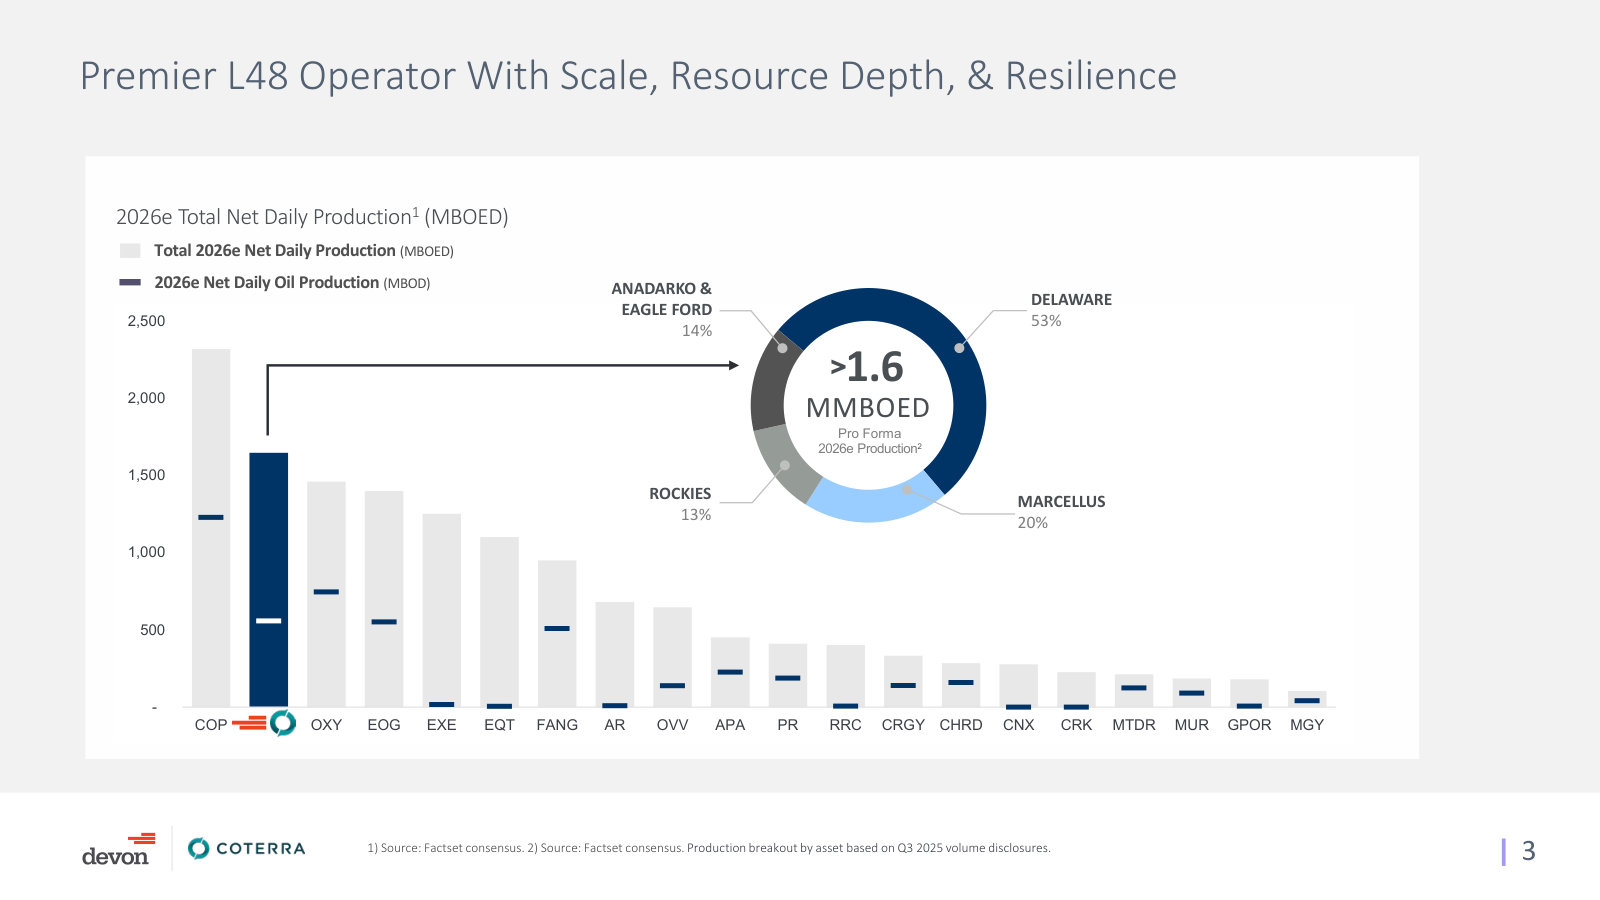
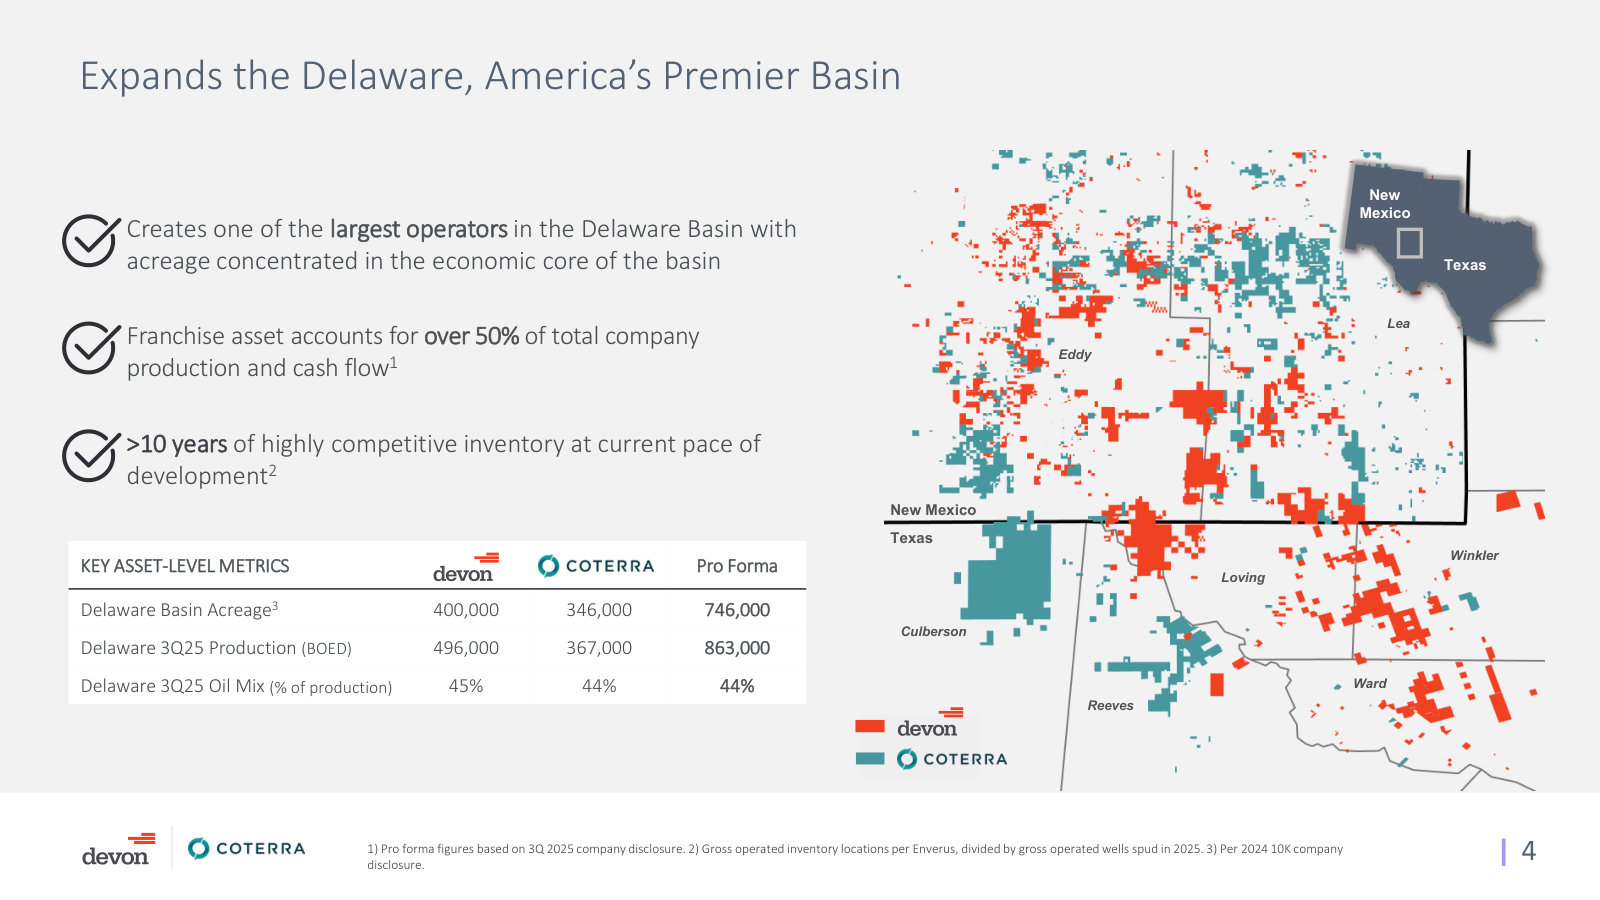
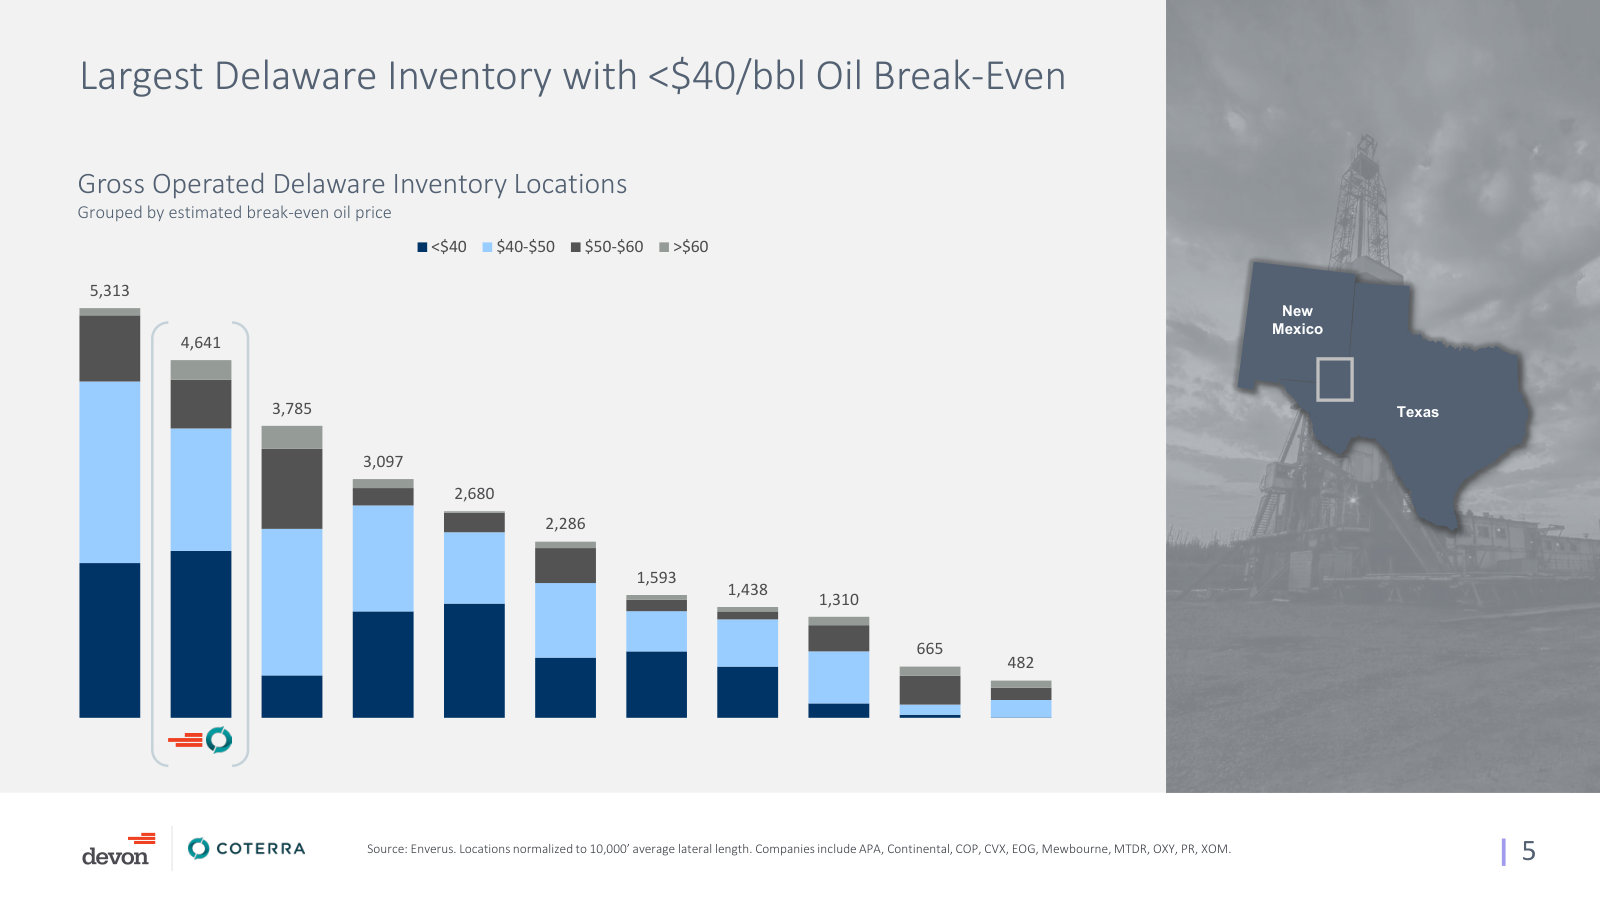
Devon & Coterra Transformative Merger — February 2026
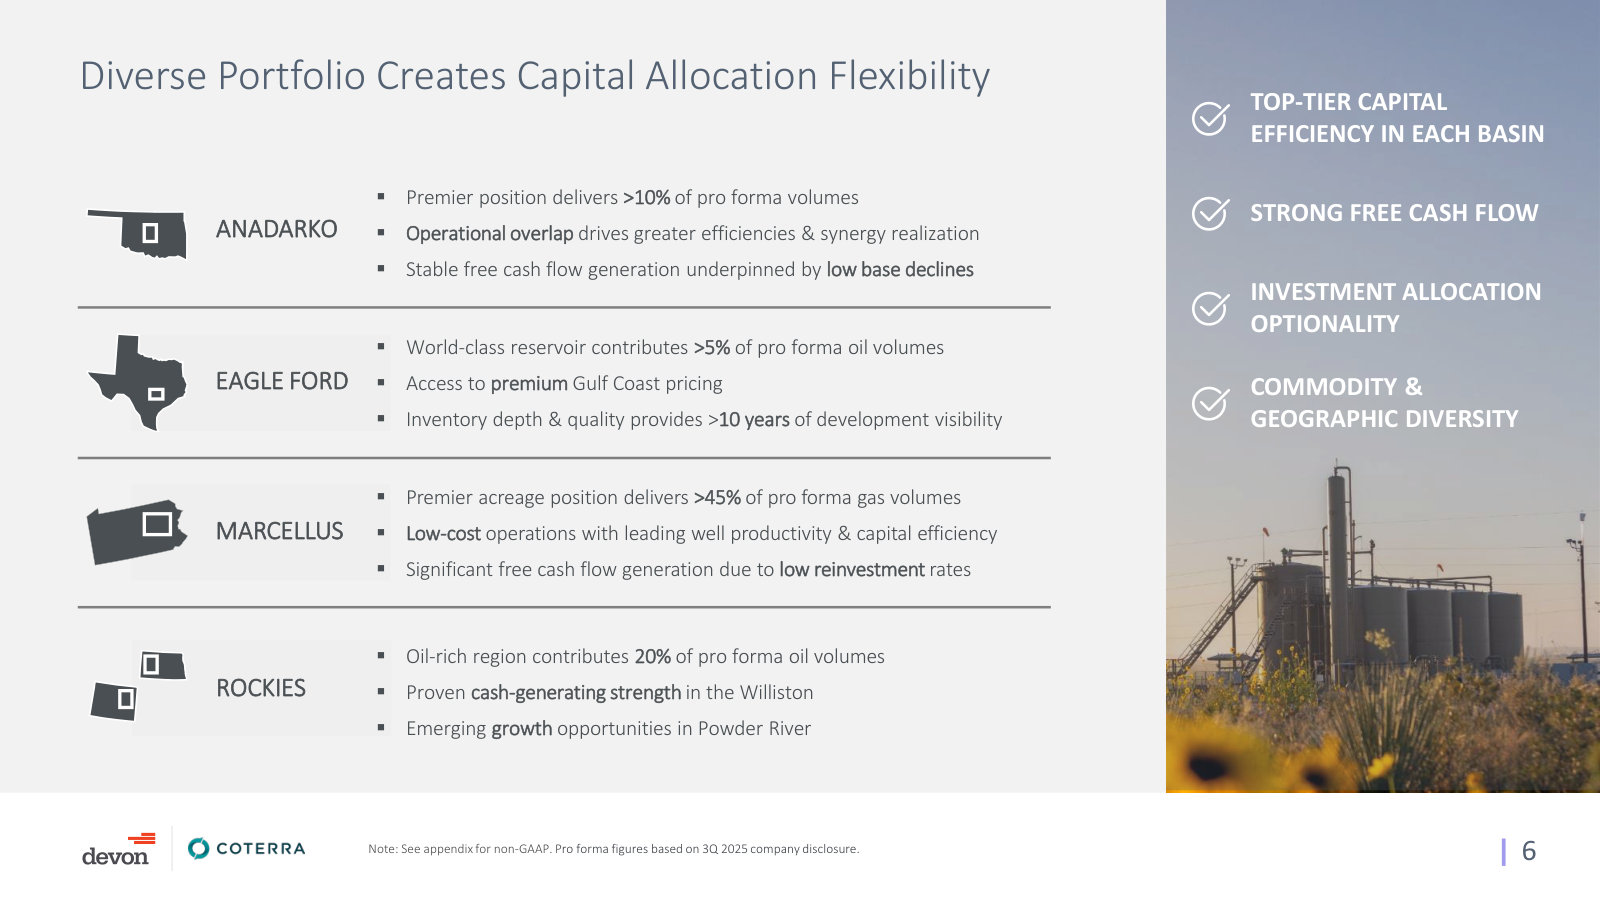
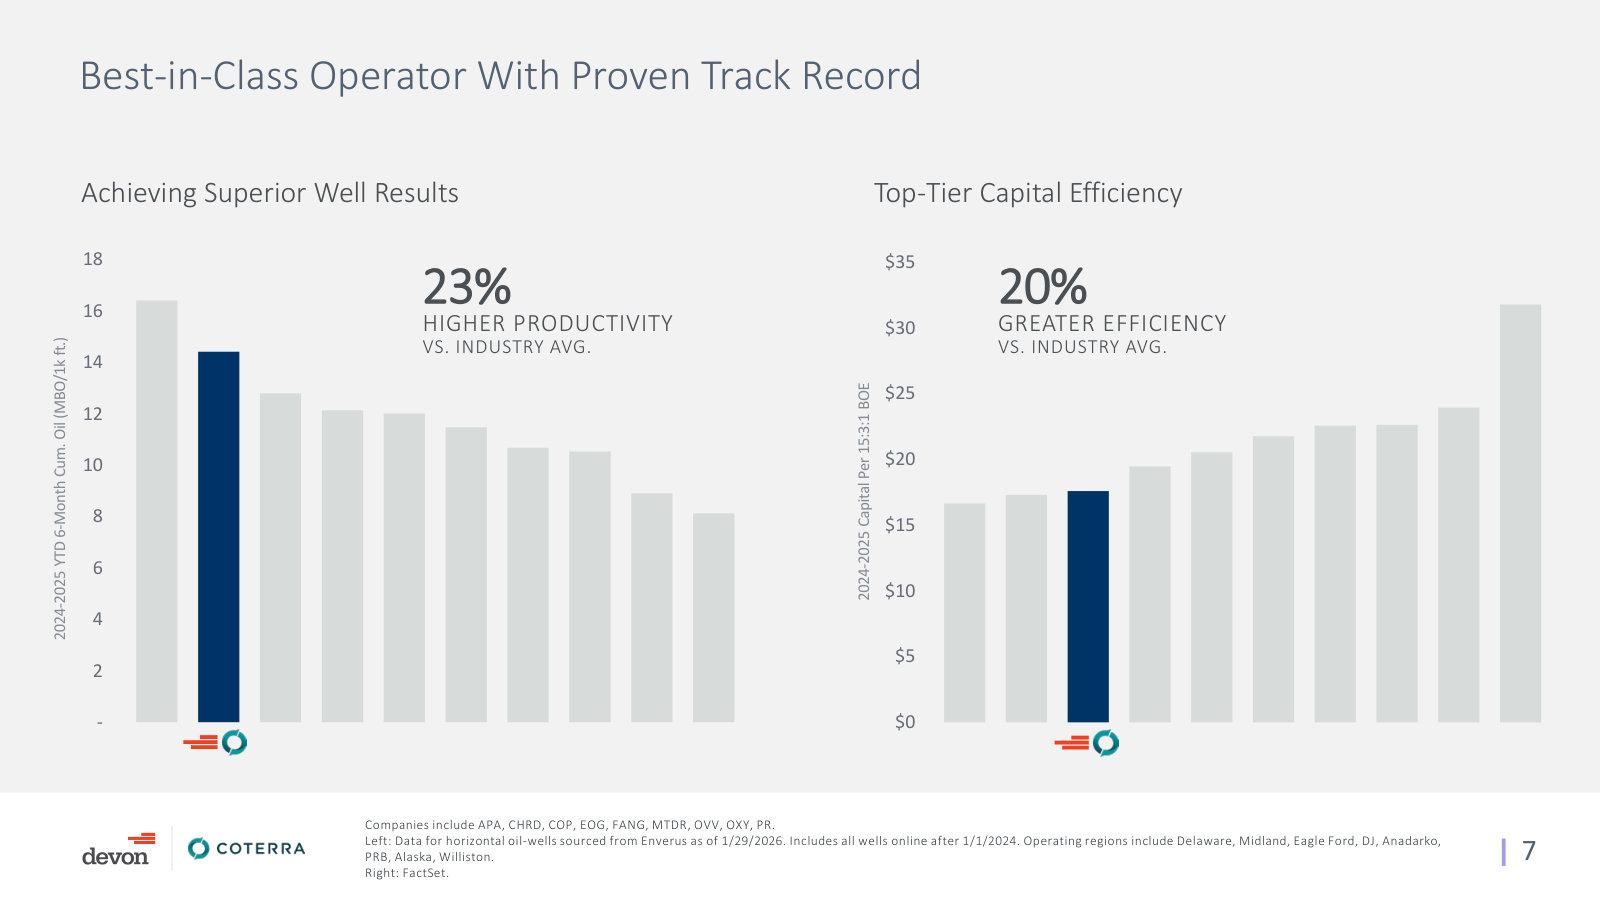
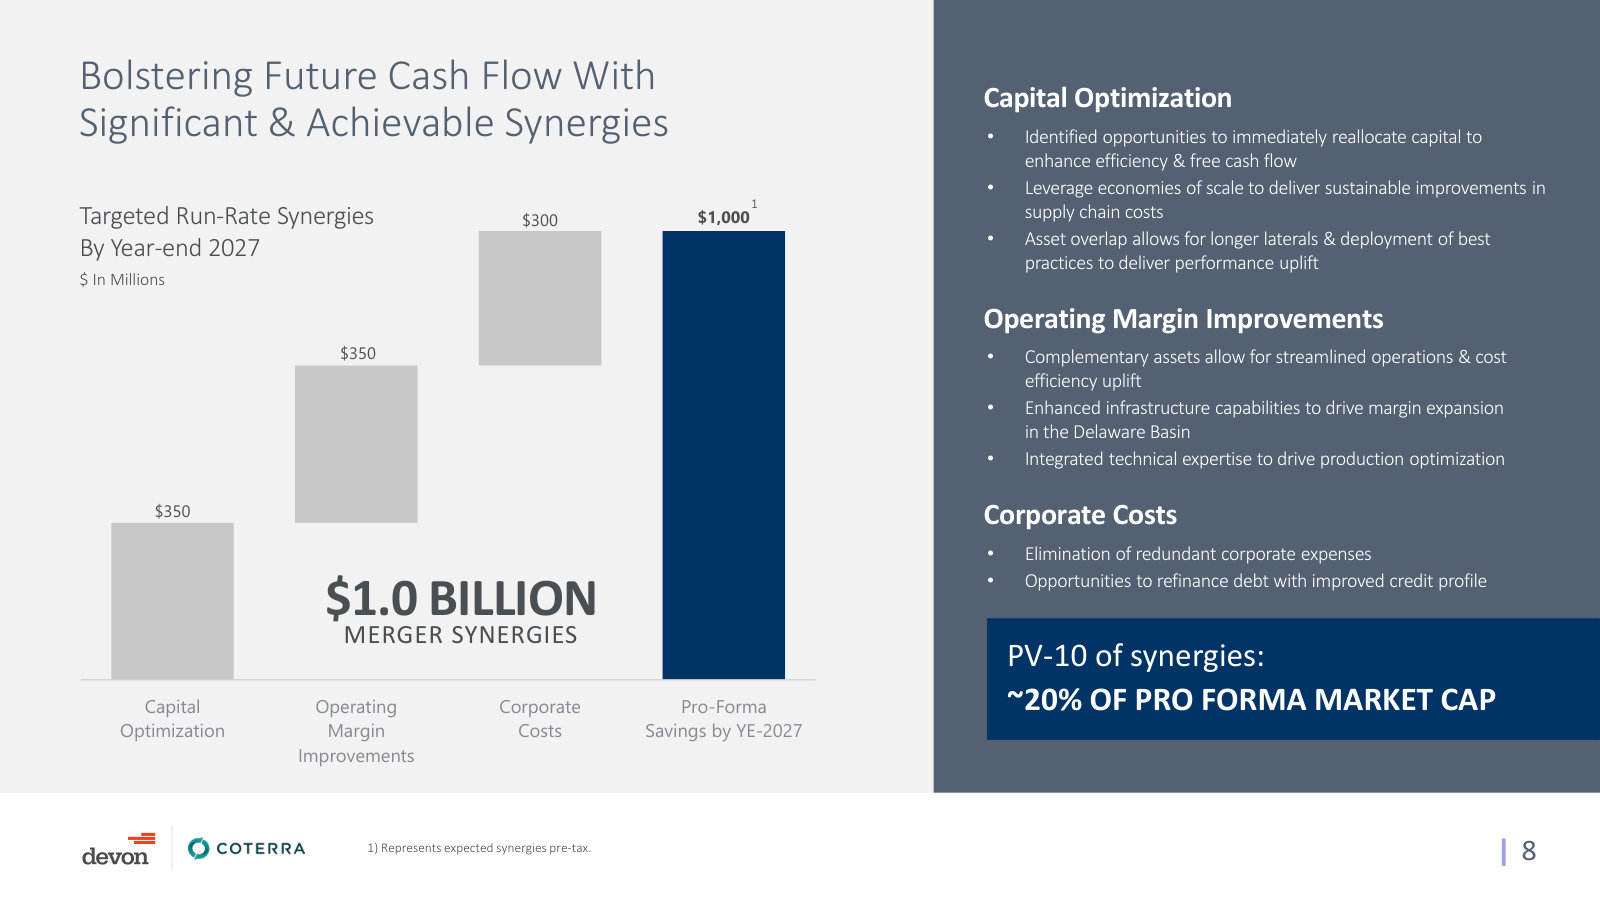
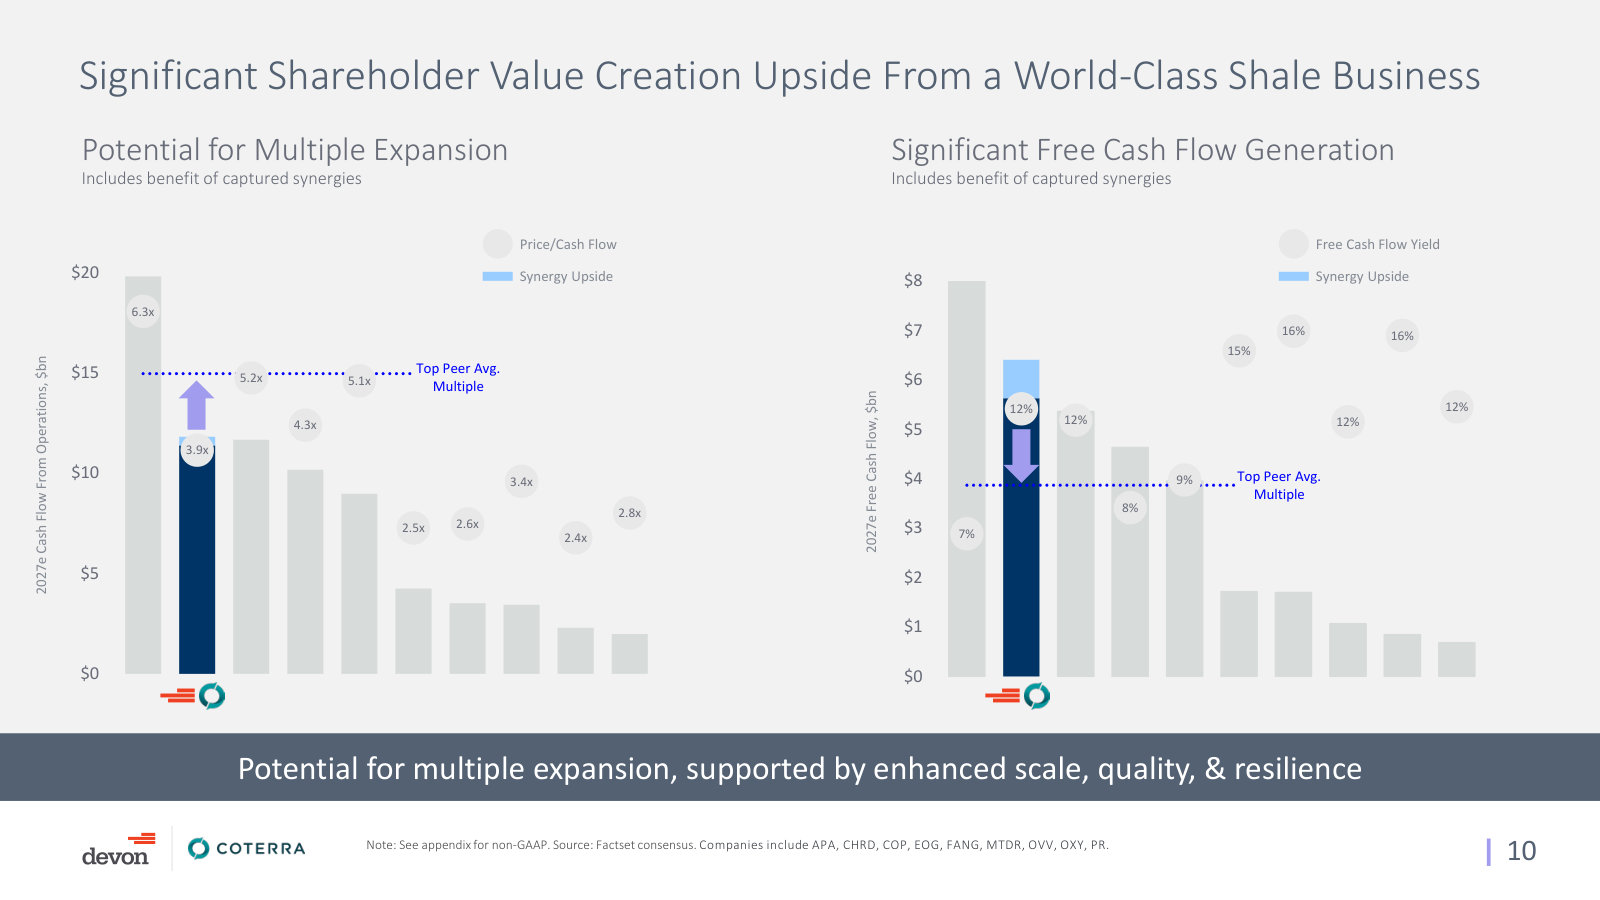
The deal deck that defines today's company — pro forma scale, basin-by-basin footprint, inventory depth and the synergy case. · Open the full document →
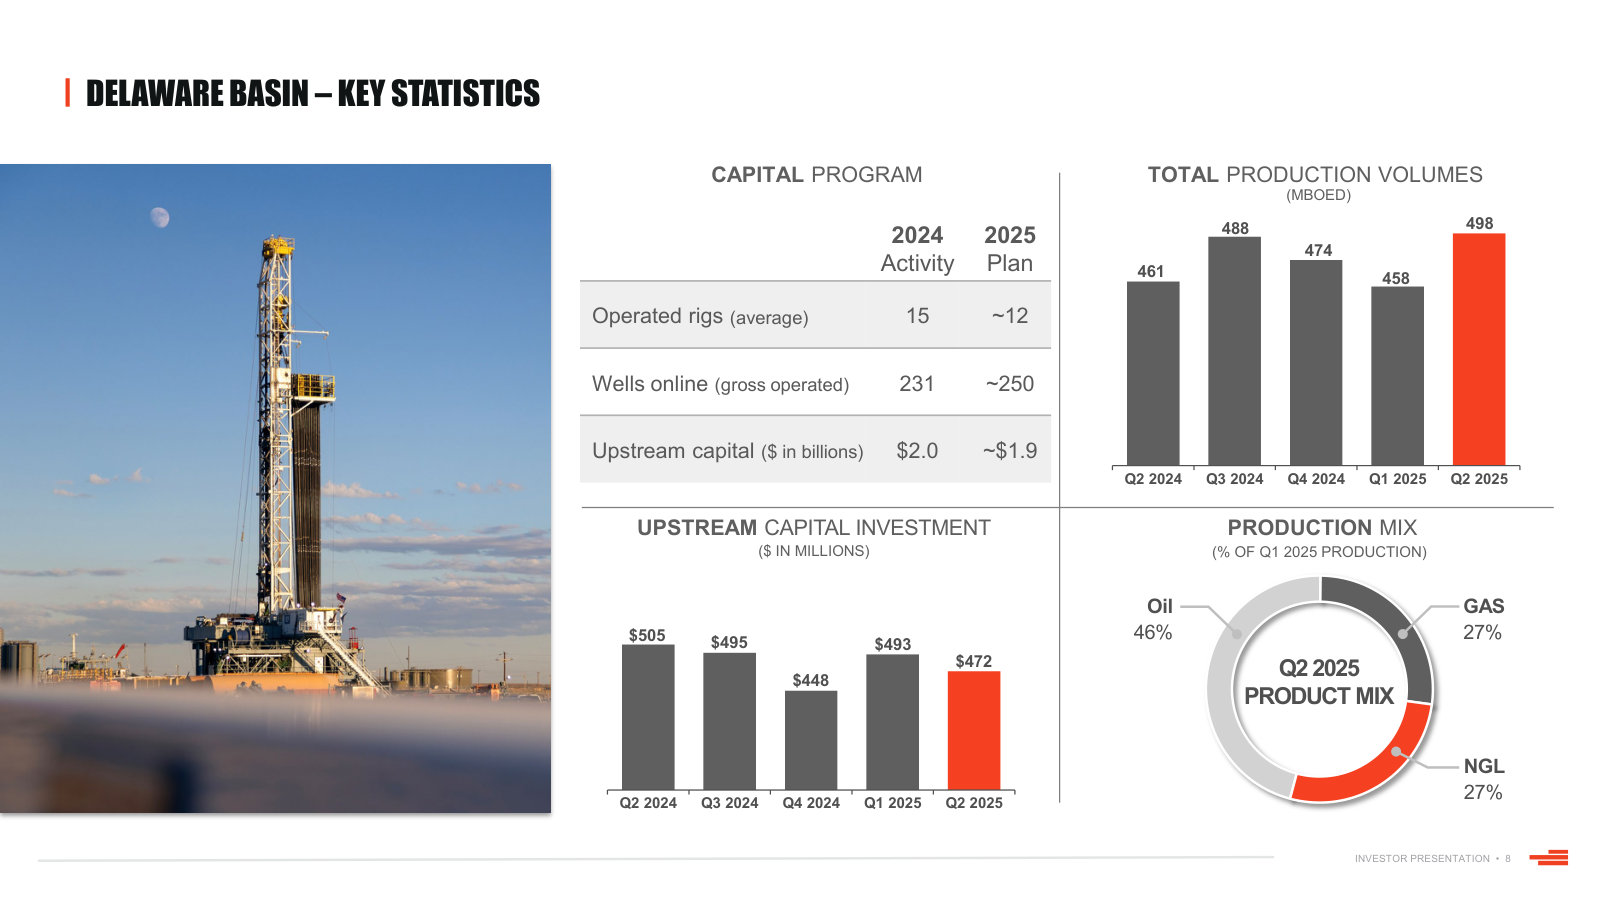
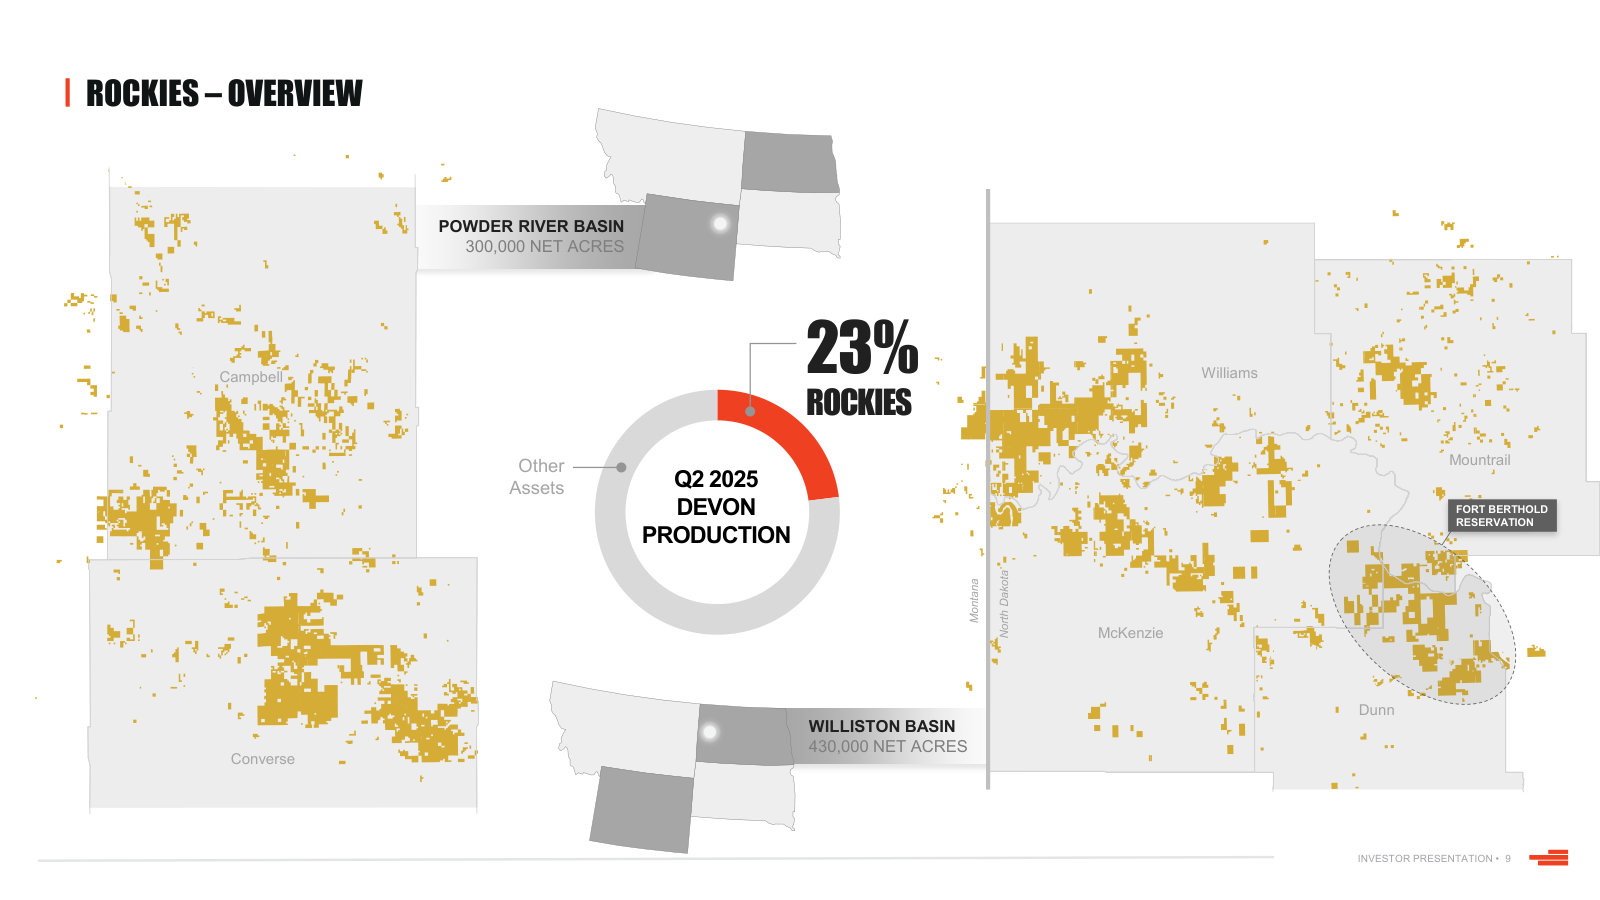
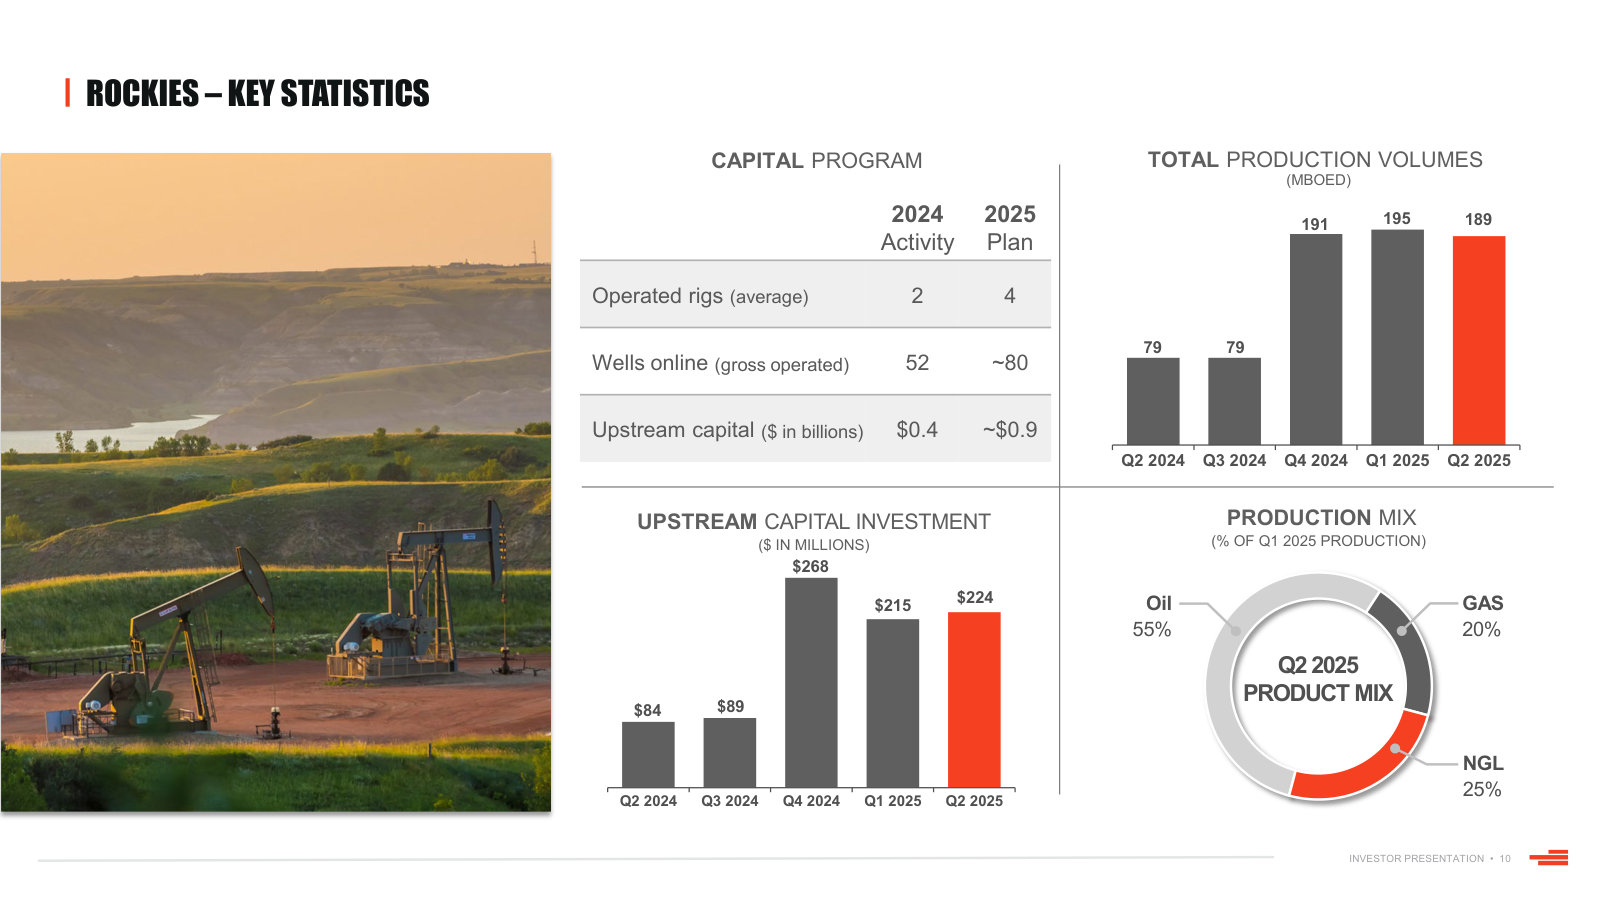
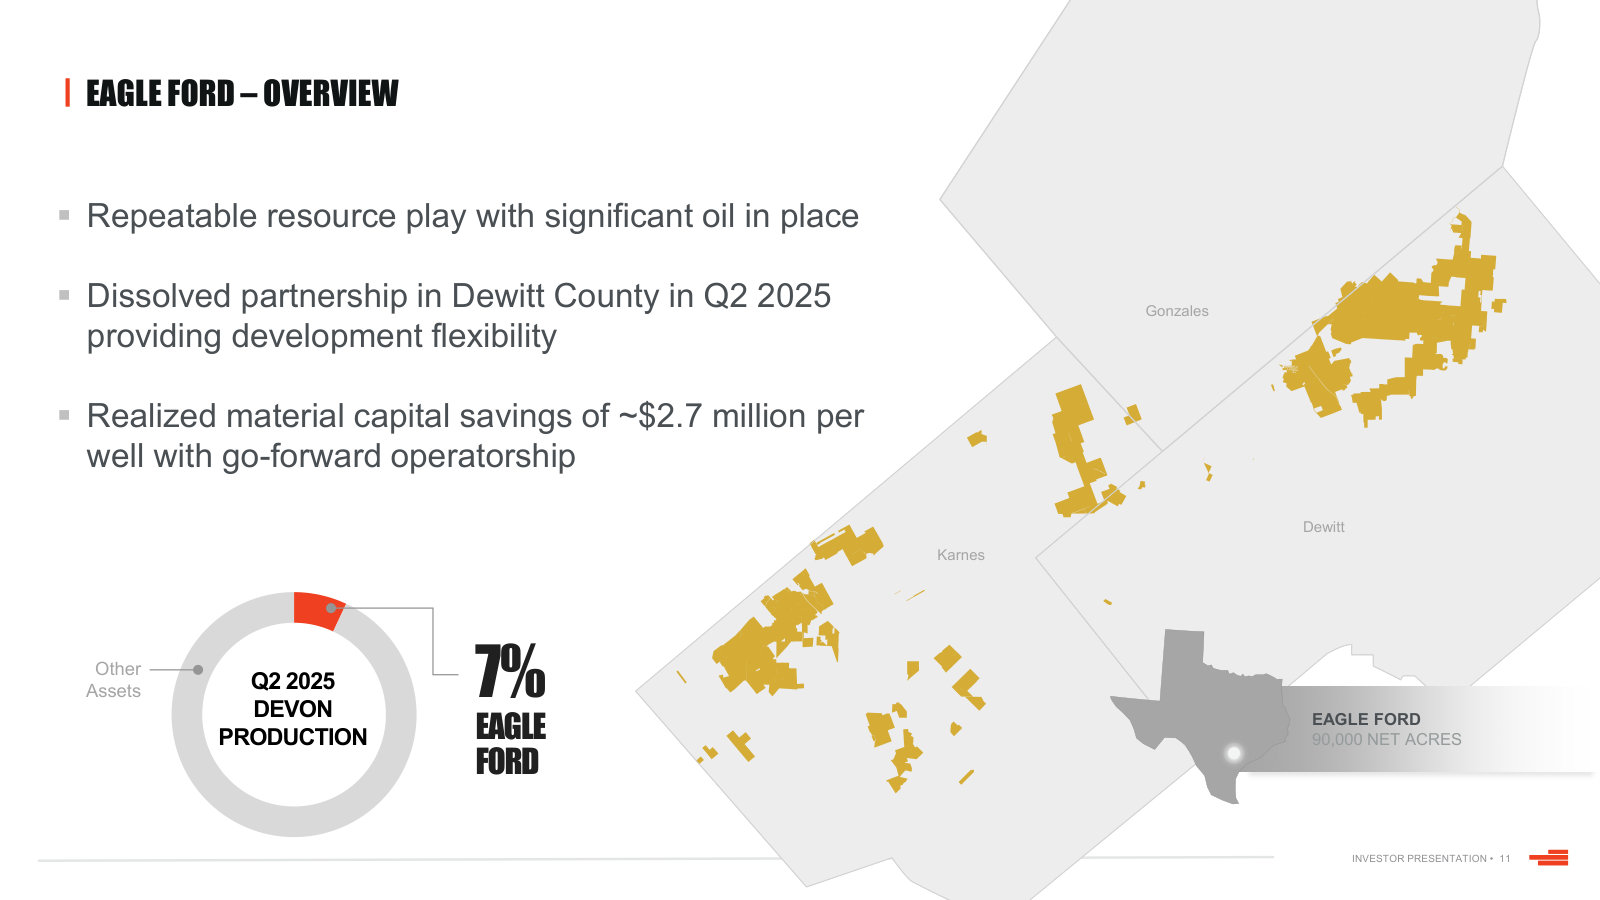
Investor Presentation — August 2025 — August 2025
The last full company-overview deck before the merger, and still the only asset-by-asset walkthrough of the legacy Devon basins. · Open the full document →
More from management
Q4 2025 Earnings Presentation — Q4 2025 · 14 pages · The full-year 2025 scorecard for standalone Devon, plus well productivity against ten named peers and the buyback record. · Open →
Q3 2025 Earnings Presentation — Q3 2025 · 14 pages · The preliminary 2026 plan Devon set before the Coterra deal — the standalone baseline the merger is measured against. · Open →
Q1 2025 Earnings Presentation — Q1 2025 · 17 pages · Where the $1bn business optimization plan was introduced, with the original category targets and timing. · Open →
Q4 2024 Earnings Presentation — Q4 2024 · 19 pages · The 2025 operating plan and a rarely repeated slide on Devon's gas marketing outlets and pricing exposure. · Open →
Q3 2024 Earnings Presentation — Q3 2024 · 16 pages · What the Grayson Mill acquisition did to the Williston business, side by side with the legacy position. · Open →
Q4 2023 Earnings Presentation — Q4 2023 · 25 pages · The pre-acquisition, pre-merger Devon: 2023 ROCE, the original 2024 plan and the capital efficiency benchmarking. · Open →
Devon Energy Corporation's management answers for the business every quarter. These are the exchanges that explain it best — verbatim, from the call transcripts preserved in Sources. Each link opens the full transcript at that page in a new tab.
Q1 2026 Earnings Conference Call — Q1 2026
The last stand-alone Devon call before the Coterra close: the new capital-return framework, the synergy plan, and an open-ended review of every asset in the combined portfolio. · Open the full transcript →
The post-merger capital-return framework: dividend up 30%+, buybacks resuming above legacy pace after a deal-driven pause.
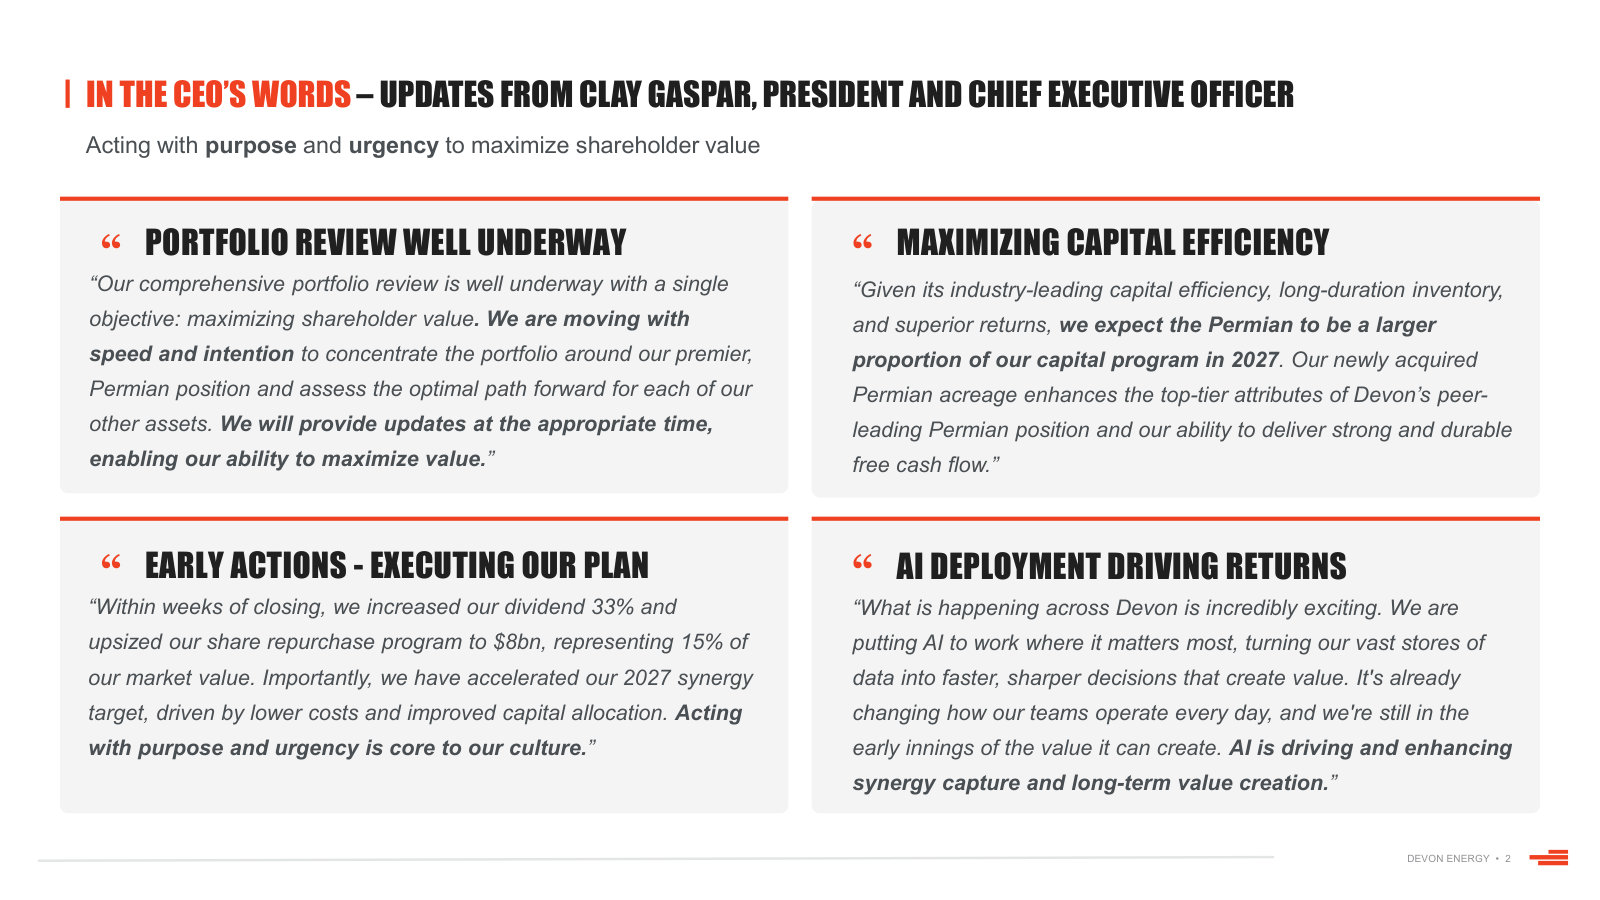
Clay Gaspar (President and CEO): Our go-forward shareholder return framework will be thoughtfully designed and competitive with our highest-quality peers. It will be balanced between dividends, share repurchases, and debt repayment. Subject to formal board approval, our dividend will increase by over 30% on a pershare basis starting in the second quarter. Additionally, both companies paused their share repurchase programs between deal announcement and close, building cash during a period of unexpectedly strong commodity prices. With the repurchase program immediately resuming post close, we are positioned to increase repurchase activity beyond our legacy level and capitalize on any discount to our intrinsic and relative value.
p. 1 · Read in context →
Sets the test every asset in the combined portfolio must pass, and opens the door to divestitures without pre-committing.
Clay Gaspar (President and CEO): Devon Energy Corporation has a 55-year history of buying and selling assets, and we are always seeking opportunities to enhance near- and long-term shareholder value. Every asset in the combined portfolio has to compete for its capital and earn its seat at the table. We have initiated a complete review of all assets against our strategic and financial criteria. While we do not have any preconceptions about future actions, we are excited to thoroughly review the portfolio with the soon-to-be combined board and remain open to all alternatives that enhance long-term value. We will be thoughtful, disciplined, and move with speed. Every option will be measured against one test: does it leave Devon Energy Corporation a stronger, more focused company on the other side?
p. 1 · Read in context →
How Devon manages negative Permian gas basis: curtail the gassiest wells, underwrite new pipe, cap residual Waha exposure.
Neal Dingmann (William Blair); Clay Gaspar (CEO); Jeffrey Ritenour (CFO): as we continue to see negative Waha prices, how much does this impact your future Permian decisions based on what you are seeing there, and how much exposure you have to Waha? […] Inevitably, what we are doing in those environments is looking to the highest gas-oil ratios—the gassiest of our assets—and pulling back on that production during that time. We saw a little bit of that in the first quarter. We can manage that wit the nominal amount of exposure we have by pulling back on some of that activity. We will continue to fight the good fight. […] When Blackcomb comes online later this year, that will further limit our exposure to Waha. We will be, call it, 10% to 15% exposure to Waha at that point going forward.
p. 4 · Read in context →
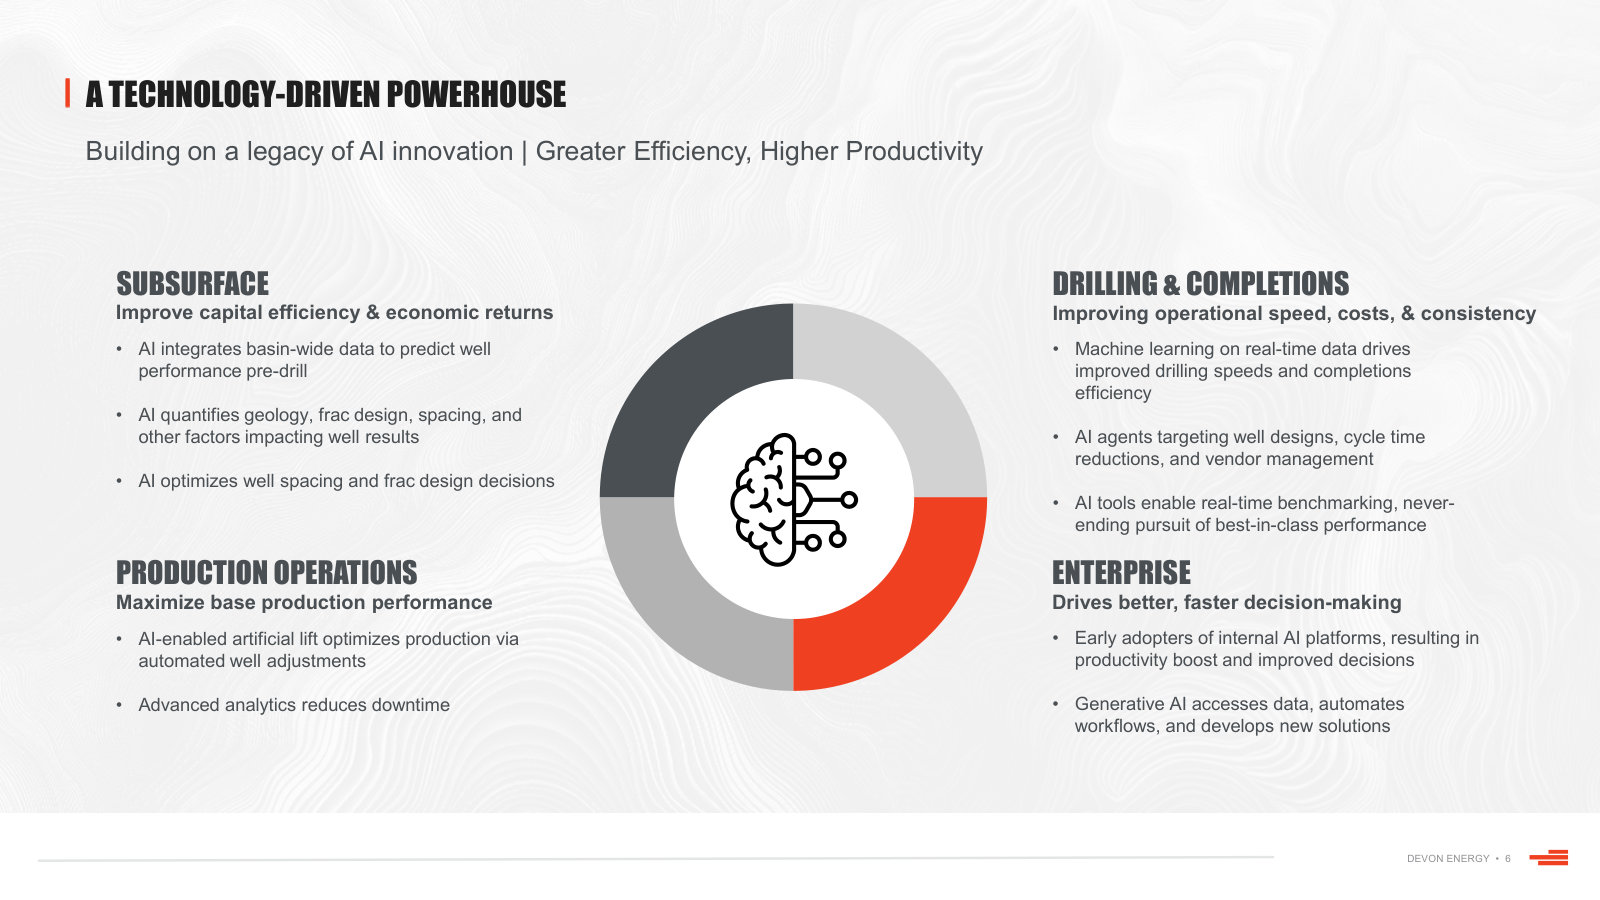
The concrete version of the AI story: closed-loop gas-lift optimization, piloted at 2–3% uplift, now scaling past 850 wells.
John Raines (SVP, Asset Management): Extremely proud of the Smart Gas Lift program. We are using AI models to develop a physics based calculation to optimize gas-lift injection rates on a closed-loop system that goes directly to the wells. We piloted this back in 2025, and we saw about a 2% to 3% uplift. We have now moved into full implementation in the Delaware Basin. We are over 850 wells at this point, and we have seen uplift in excess of what we saw in the pilot phase. We are on our way to 1.5 thousand wells across the portfolio. I do not want to give a specific number on uplift yet—just that it is better than what we saw in the pilot because it is early.
p. 9 · Read in context →
The hardest question: how credible is a synergy number set before the teams could legally look at each other's books.
Doug Leggate (Wolfe Research); Clay Gaspar (CEO): Have you been able to get under the hood on the combined company and Cotera’s portfolio and assets, given the merger has not closed yet? How should we think about the veracity of the $1 billion target versus the number of opportunities you mentioned in your prepared remarks? […] We have moved aggressively. For a combined 70 billion company to do a sign-to-close in three months is moving with incredible speed. At the same time, we have been incredibly disciplined on what we can and cannot do—there are very strict rules around what we could and could not share. There is an ability to use something called a clean room, where we can exchange certain data with third parties, and we have done some things like that. We have been able to exchange a certain amount to now, but had to work a lot of this independently. Of course, even to get to the merger agreement and get the deal signed, both teams needed to work this independently and understand the why for their shareholders. Between sign and close, we have been able to share some data and get closer by leveraging third parties and staying well […] I am not raising the $1 billion number or accelerating the timeline. What I want to give investors confidence in is when we say $1 billion by the end of next year, we feel confident, and we will be able to deliver, much like we delivered on our last business optimization goal.
p. 11 · Read in context →
Q4 and Full-Year 2025 Earnings Conference Call — Q4 FY2025
The first call after the Coterra announcement: merger logic and synergy accounting, the 2025 capital-return record, and unusually specific detail on Delaware base performance and program mix. · Open the full transcript →
The merger case in management's own words, and the accounting rule for what does and does not count as synergy.
Clay Gaspar (CEO): The merger unites complementary portfolios with substantial and overlapping positions across the best U.S. shale basins. At the heart of this combined portfolio is a world-class position in the Delaware Basin, which will generate more than half of our total production and cash flow, backed by a decade-plus of top-tier inventory. […] In total, we expect to deliver $1 billion in annual pretax run rate synergies by year-end 2027. These synergy targets are incremental to our business optimization program and reflect true operational and efficiency gains. Importantly, if there are any net reductions in activity levels, these capital savings will be incremental to our announced $1 billion target.
p. 1 · Read in context →
Reserve replacement and F&D cost — the cleanest single read on whether a shale program is replacing what it produces.
Clay Gaspar (CEO): I also want to highlight our impressive reserve performance for 2025. Our capital program achieved a reserve replacement rate of 193% of production at an F&D cost of just over $6 per BOE. While a single year of reserves booking should never be viewed as a sole measure of success, this result provides compelling evidence of the quality and sustainability of our advantaged multi-basin portfolio.
p. 2 · Read in context →
The full capital-return stack for 2025 and the step-up planned at close: fixed dividend, buyback authorization, leverage.
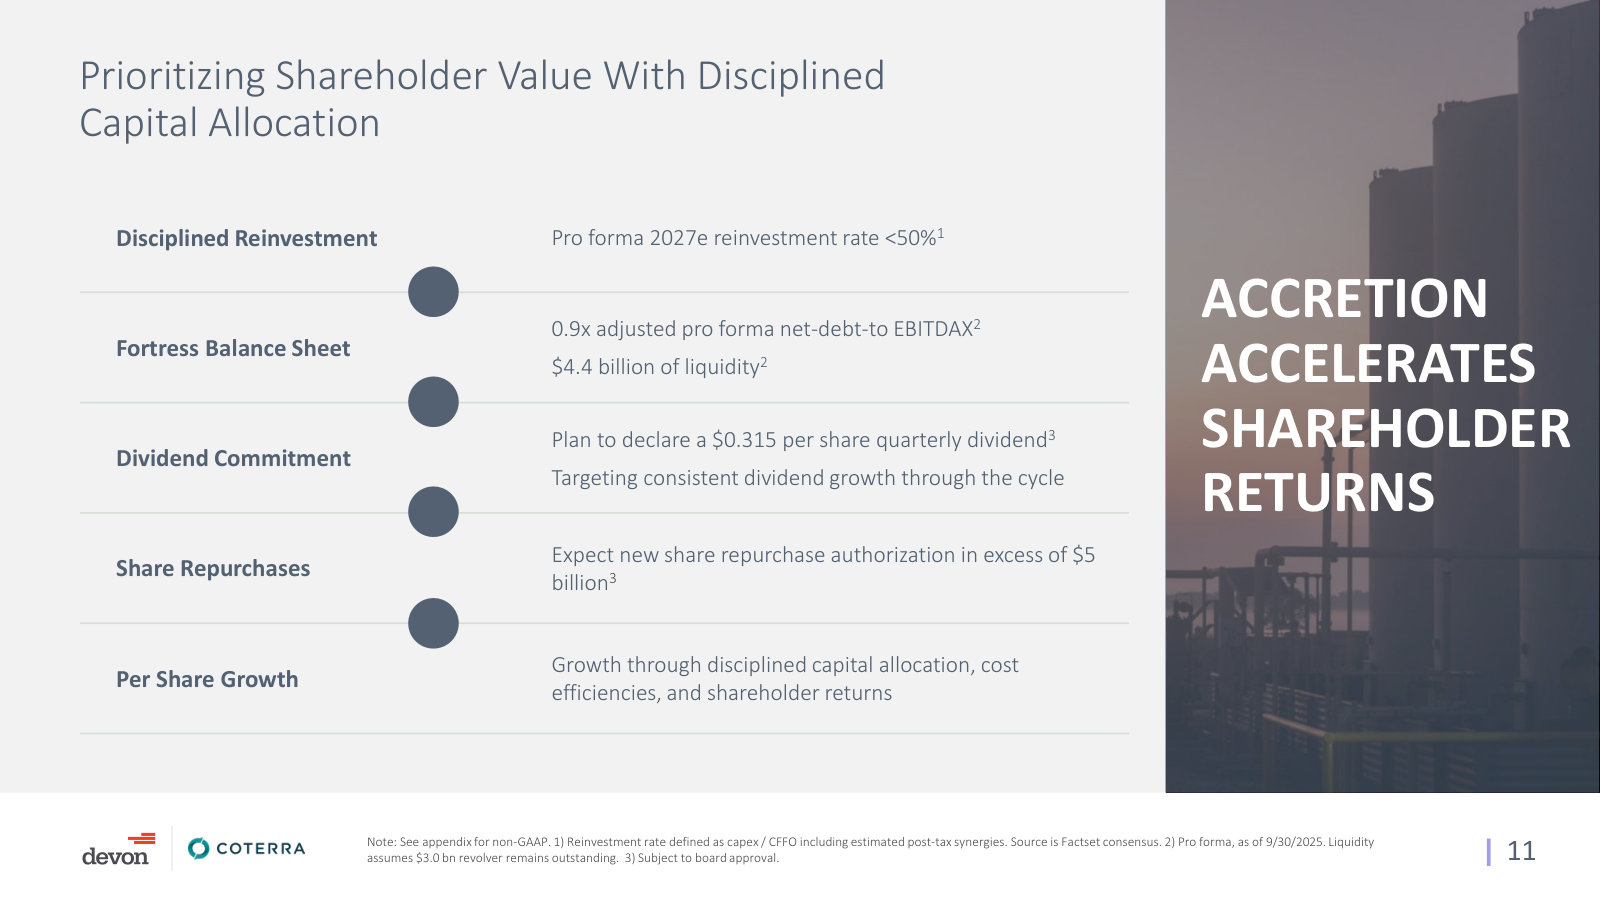
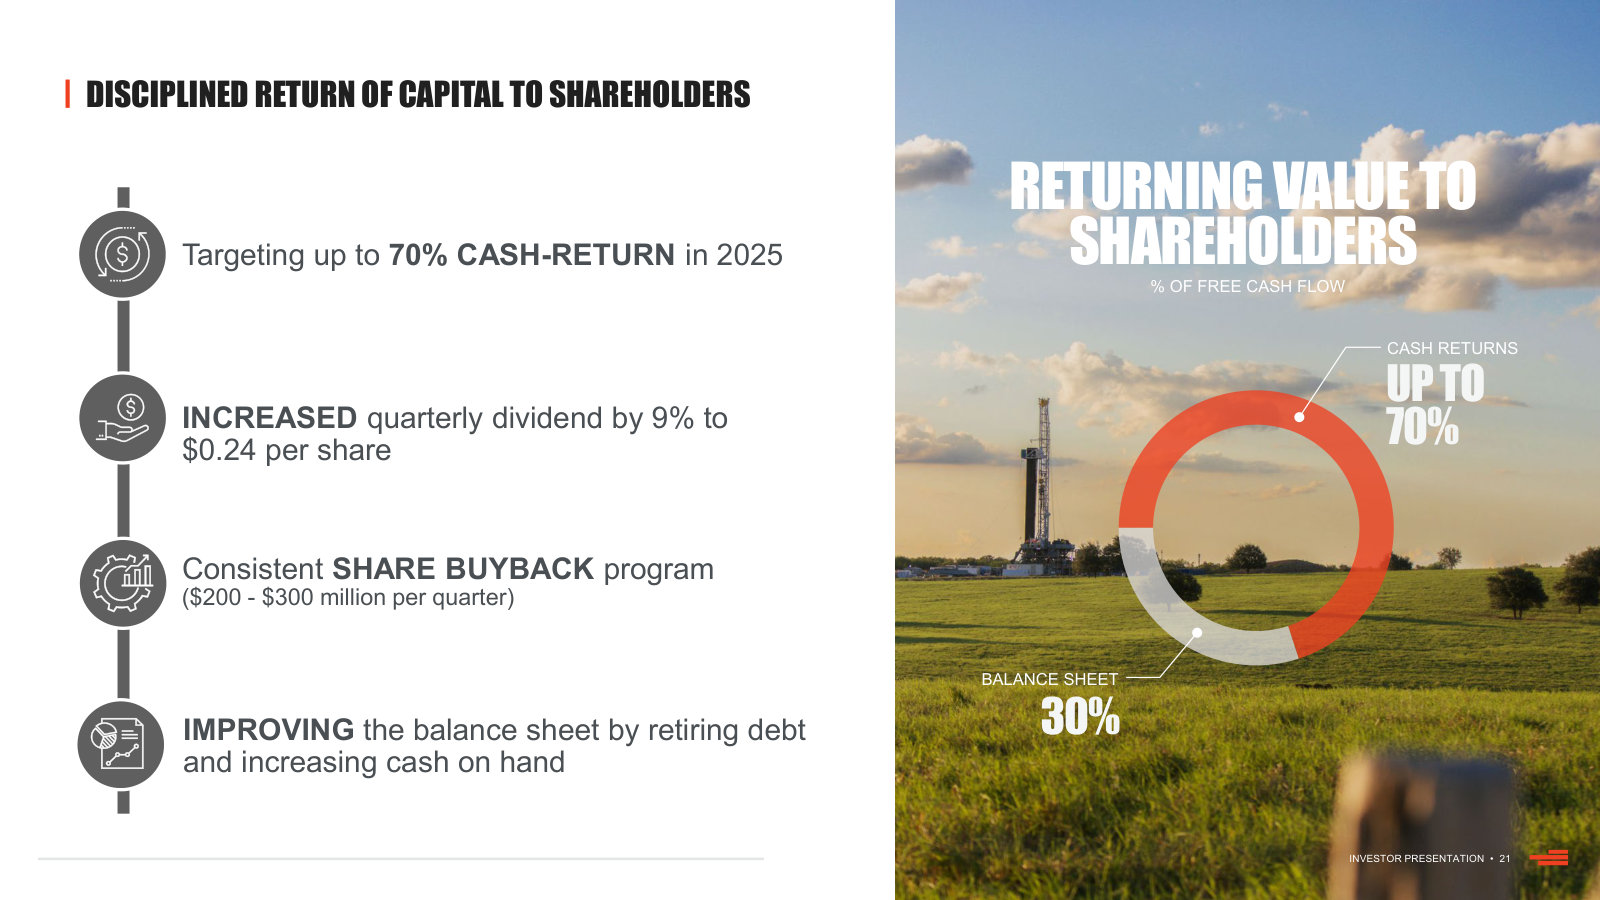
Jeffrey Ritenour (CFO): In 2025, we generated $3.1 billion in free cash flow, demonstrating the strength of our asset base and the effectiveness of our operational execution. This robust free cash flow enabled us to return $2.2 billion to shareholders through dividends, share buybacks, and debt retirement. We remain committed to growing our fixed dividend through the cycle. In 2025, we increased our quarterly dividend by 9% to $0.24 per share. Following the expected close of the Devon and Coterra merger and pending Board approval, we plan to raise our fixed quarterly dividend by another 31%, reflecting our strong confidence in the combined company's ability to capture synergies and to deliver an enhanced cash return profile to shareholders. We're also focused on opportunistically reducing our share count and returning value through buybacks. Over the past year, we've reduced our shares outstanding by approximately 5% through disciplined repurchases. Following the merger close and with Board approval, we anticipate a new share repurchase authorization of more than $5 billion, providing significant capacity to deliver strong per share growth over the next several years.
p. 3 · Read in context →
Splits a production beat into new-well timing versus base management, and sizes what base optimization is worth.
John Raines (SVP, Asset Management): I mean, really, the story is twofold. We did have some help from timing on the wedge. We had three incredible programs come on in the fourth quarter. The timing helped, but also the wells all outperformed our internal expectations there. The well mix for us changes quarter to quarter, but we had a pretty balanced well mix. These three programs, in particular, had a good balance of Wolfcamp B, Bone Spring, but also Wolfcamp A. All of those things were contributing factors. But Clay is right, we would be remiss not to talk about the base. Throughout the course of 2025, we saw a lot of production optimization through various projects on the base. All in all, for the full year, the base outperformed by about 5,000 barrels of oil a day. So when you think about that type of contribution on the base, it's almost 2% of the base. That's just a huge part of our business and an exceptional result and exceptional value to the company.
p. 8 · Read in context →
Base decline is still mid-30%; the gain came from cutting downtime from ~7% to under 5%, not from bending the decline curve.
Clay Gaspar (CEO), answering Paul Cheng (Analyst): Paul, if you were asking about decline rates, right now, yes, our base decline rates are in the mid-30% range. […] I'd say we've had some tailwinds on the base. The decline rate itself hasn't changed dramatically year-over-year. Now granted, we're about a year into a lot of these production optimization projects. What I would tell you is our downtime is significantly lower. […] Historically, that was in the 7% range. As we go into this year, we're looking at something inside of 5%. So that's really where you're seeing a lot of the base wins show up.
p. 8 · Read in context →
How the Delaware program is actually built — geography and zone mix — and why that makes productivity predictable.
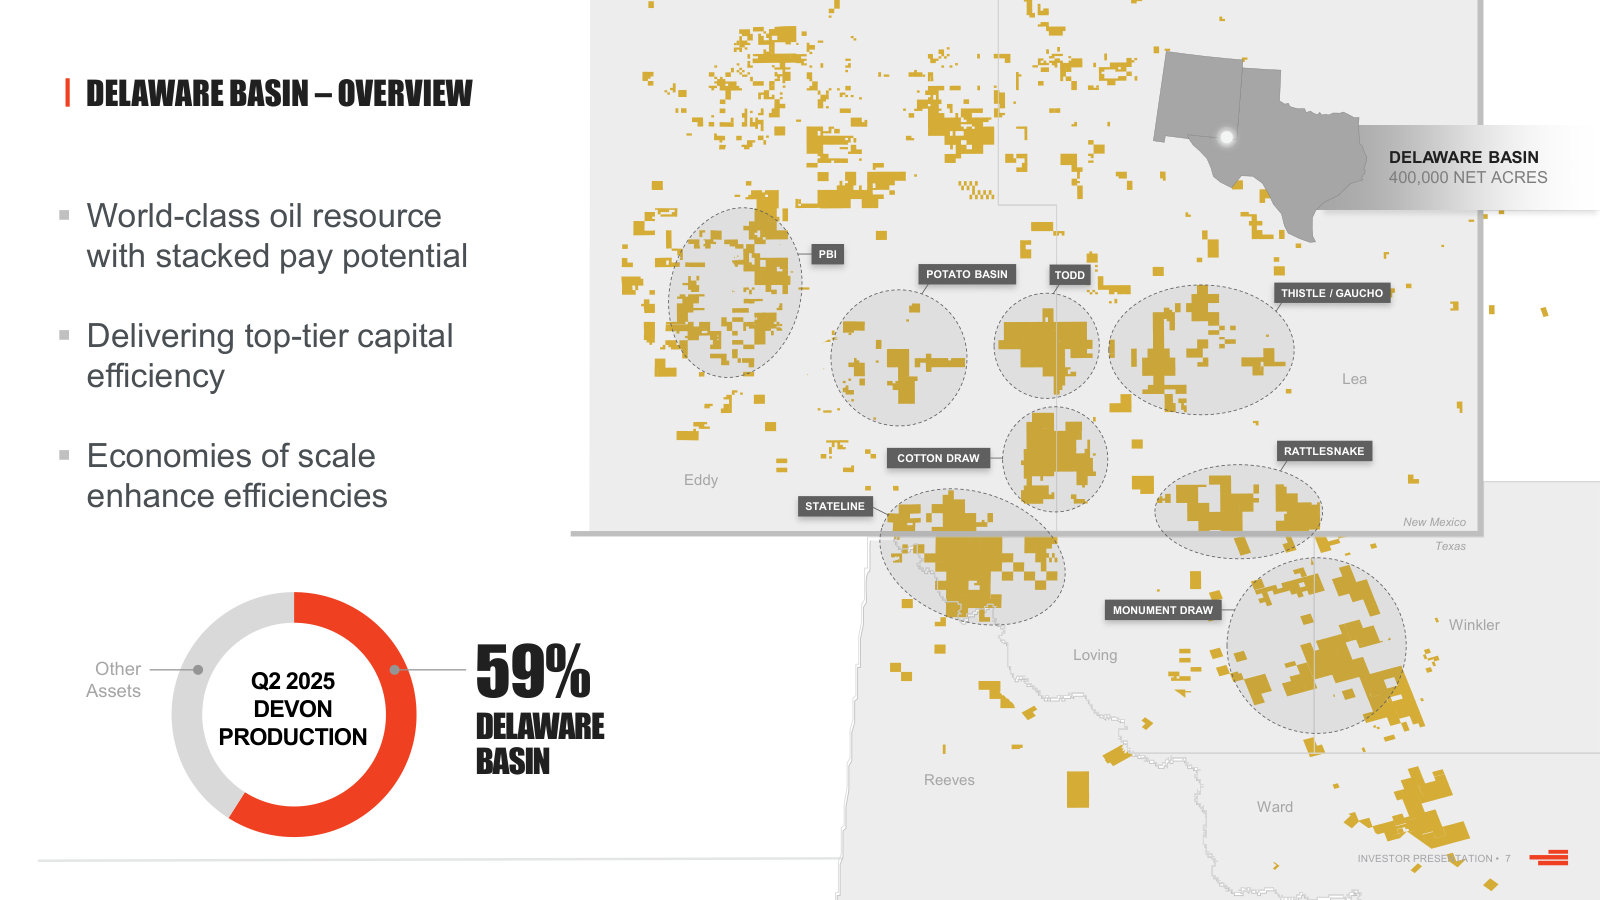
Clay Gaspar (CEO), answering Kevin MacCurdy (Analyst): So just top line 2025 well productivity. 2026 is going to look very similar to that. We moved more wholesomely into the multi-zone co-development in 2025. We're firmly into that development methodology. So you'll see very consistent well productivity in 2026. When I think about the mix, the one thing I would ask folks to consider is I'm going to talk about the full year, but these things can vary pretty significantly quarter to quarter. But as I think about the program, about 90% of our activity is going to be weighted to New Mexico. When I break that down a little bit further kind of by area, we'll see a little bit of an uptick in Tod this year in the Delaware; it's about 30%. Cotton Draw is about 25%, Stateline is about 15%. And then the balance of that activity is really spread out across the remainder of the Delaware Basin. Zone mix is another thing. We've got a lot of diversity in the zones for 2026, just like we did in 2025. But just to break it down at a high level, we're about 40% Wolfcamp, about 45% Bone Spring, and about 15% Avalon. So all those things are very similar to 2025. Because of that, we're expecting pretty consistent year-over-year well productivity.
p. 8 · Read in context →
Q1 2025 Earnings Conference Call — Q1 2025
The call that laid out the $1 billion business optimization plan line by line, and set explicit rules for when a price crash would change the capital program. · Open the full transcript →
The breakeven anchor and the launch of the $1 billion free-cash-flow target that framed the next four quarters.
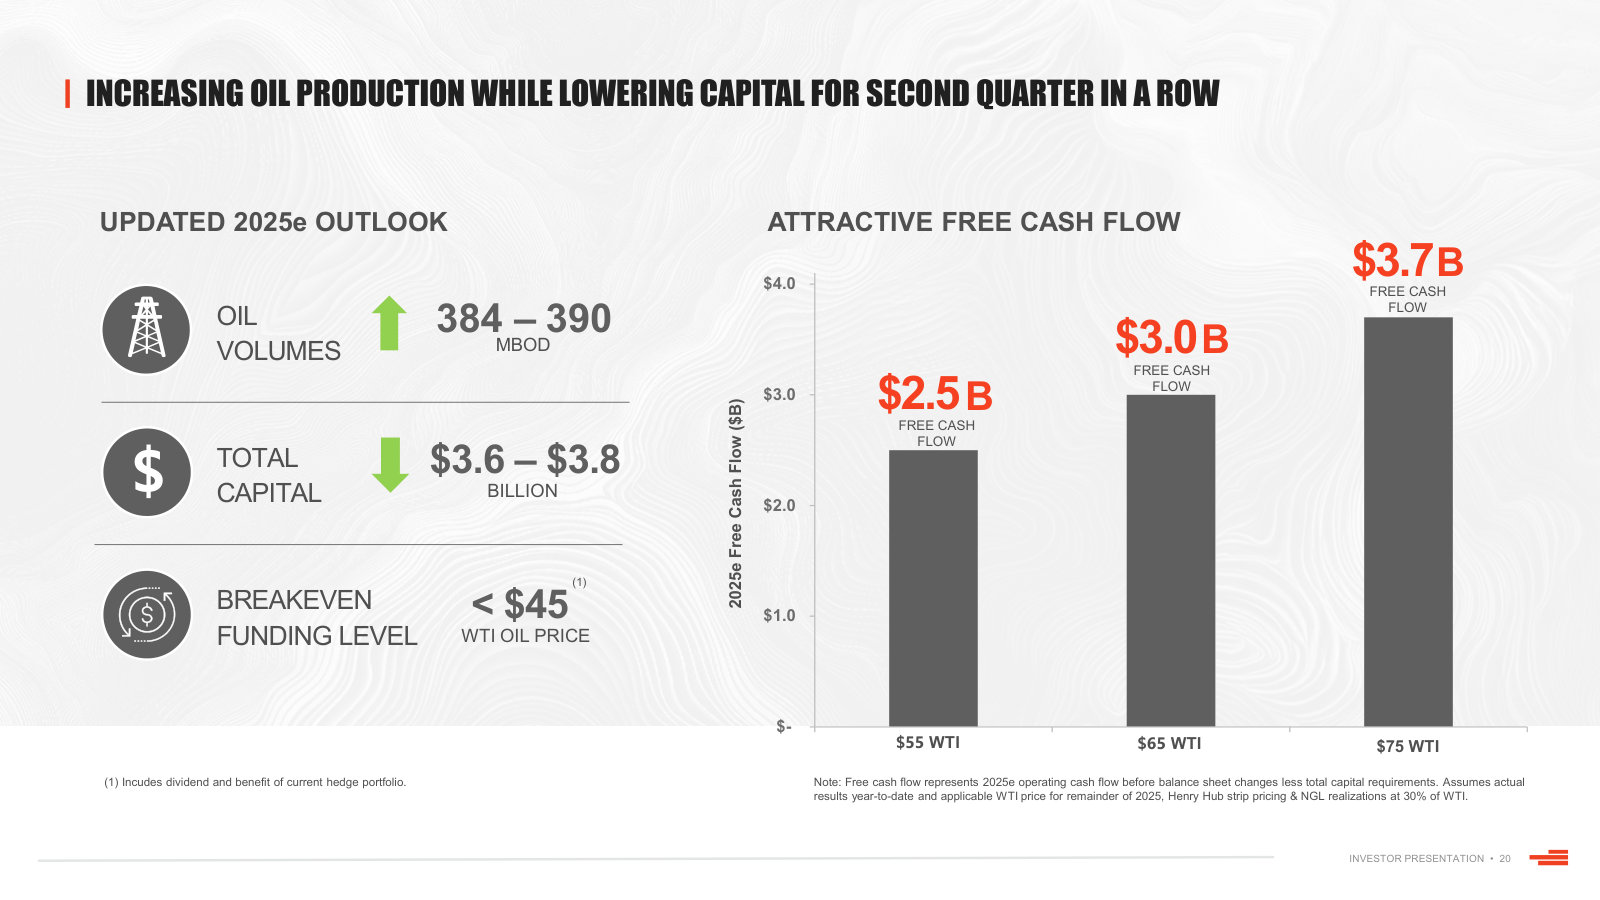
Clay Gaspar (President and CEO): In a market characterized by dynamic headwinds, Devon stays focused first on what we can control. Leveraging Devon's fifty-year history and an experienced leadership team prepared to handle the uncertainty of commodity price cycles, we remain confident in our value creation strategy. We're committed to our capital return framework, underpinned by our high-quality portfolio and our robust financial strength. With an investment-grade balance sheet and a $45 corporate breakeven, we are wellpositioned to generate value even in a low-price environment. With the recent changes in leadership across our organization and the resulting fresh perspectives, we believe that this is an opportune time for us to accelerate our business optimization efforts and deliver an additional $1 billion in annual free cash flow by year-end '26.
p. 1 · Read in context →
Efficiency gains banked as fewer rigs rather than more barrels — the clearest statement of Devon's growth philosophy.
Clay Gaspar (President and CEO): As a reminder, we started the year expecting to run 14 rigs acros the Delaware position, but now expect to reduce activity to 11 rigs in the second half of the year. Along with this reduction in rigs in the Delaware, we expect to build in some frac gaps both in Delaware and the Williston, given the improvement to our completion efficiency. Importantly, despite the reduction in rigs and frac activity, we're able to maintain our productive capacity and confidence in our production outlook. This plan highlights our commitment to capturing these improvements through capital discipline rather than growing production in a saturated oil market.
p. 1 · Read in context →
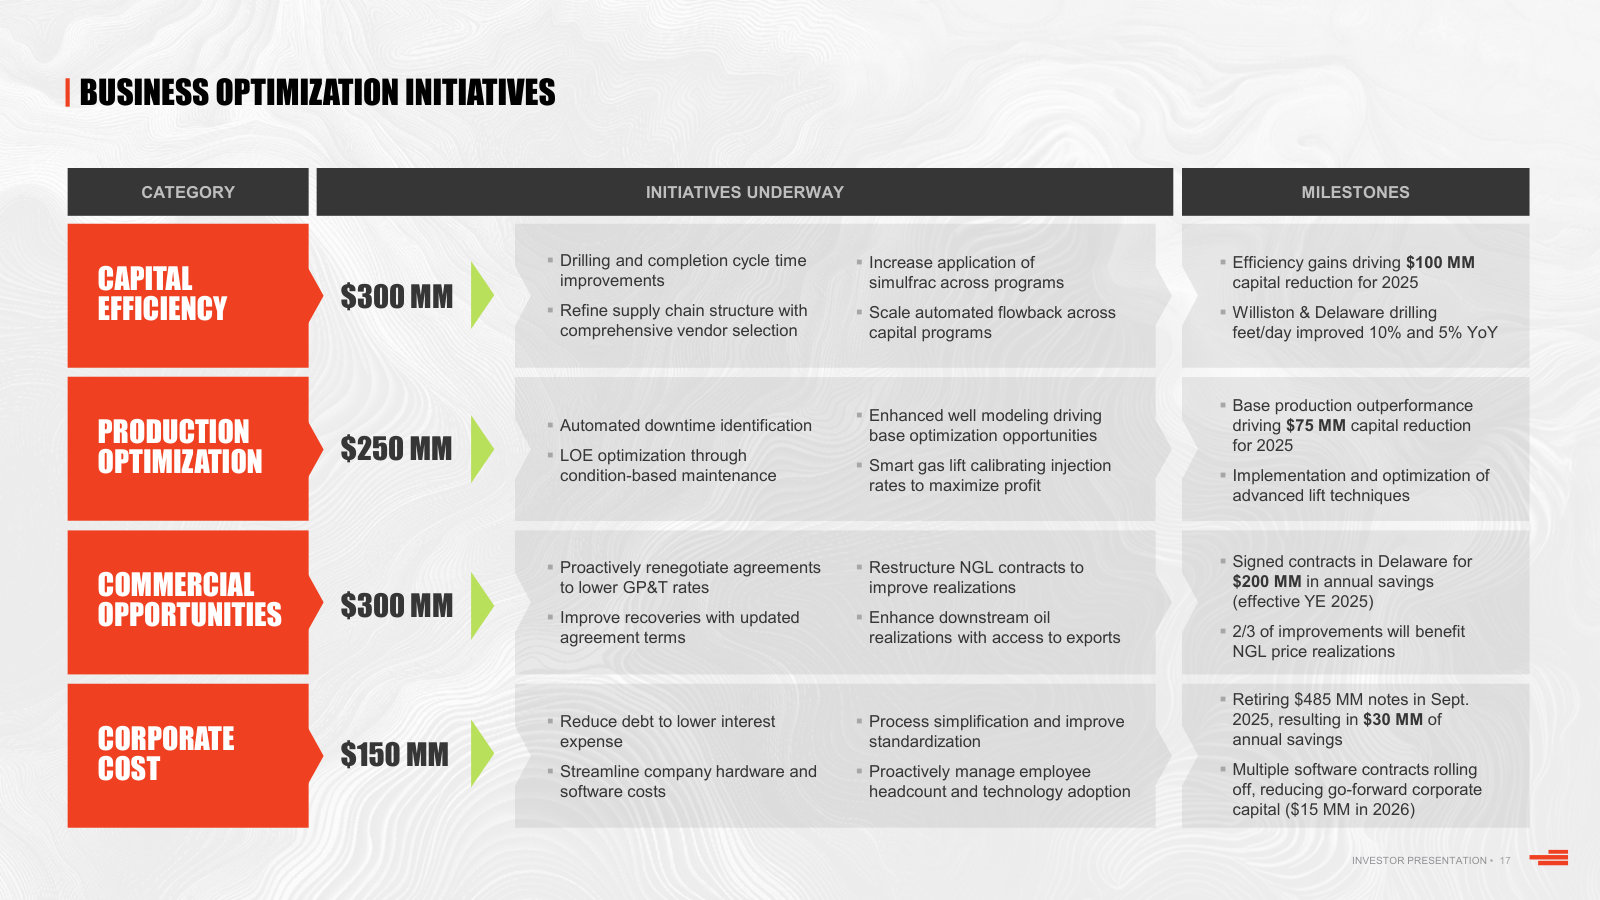
The $1 billion target broken into its four buckets, with the per-share value management attached to delivering it.
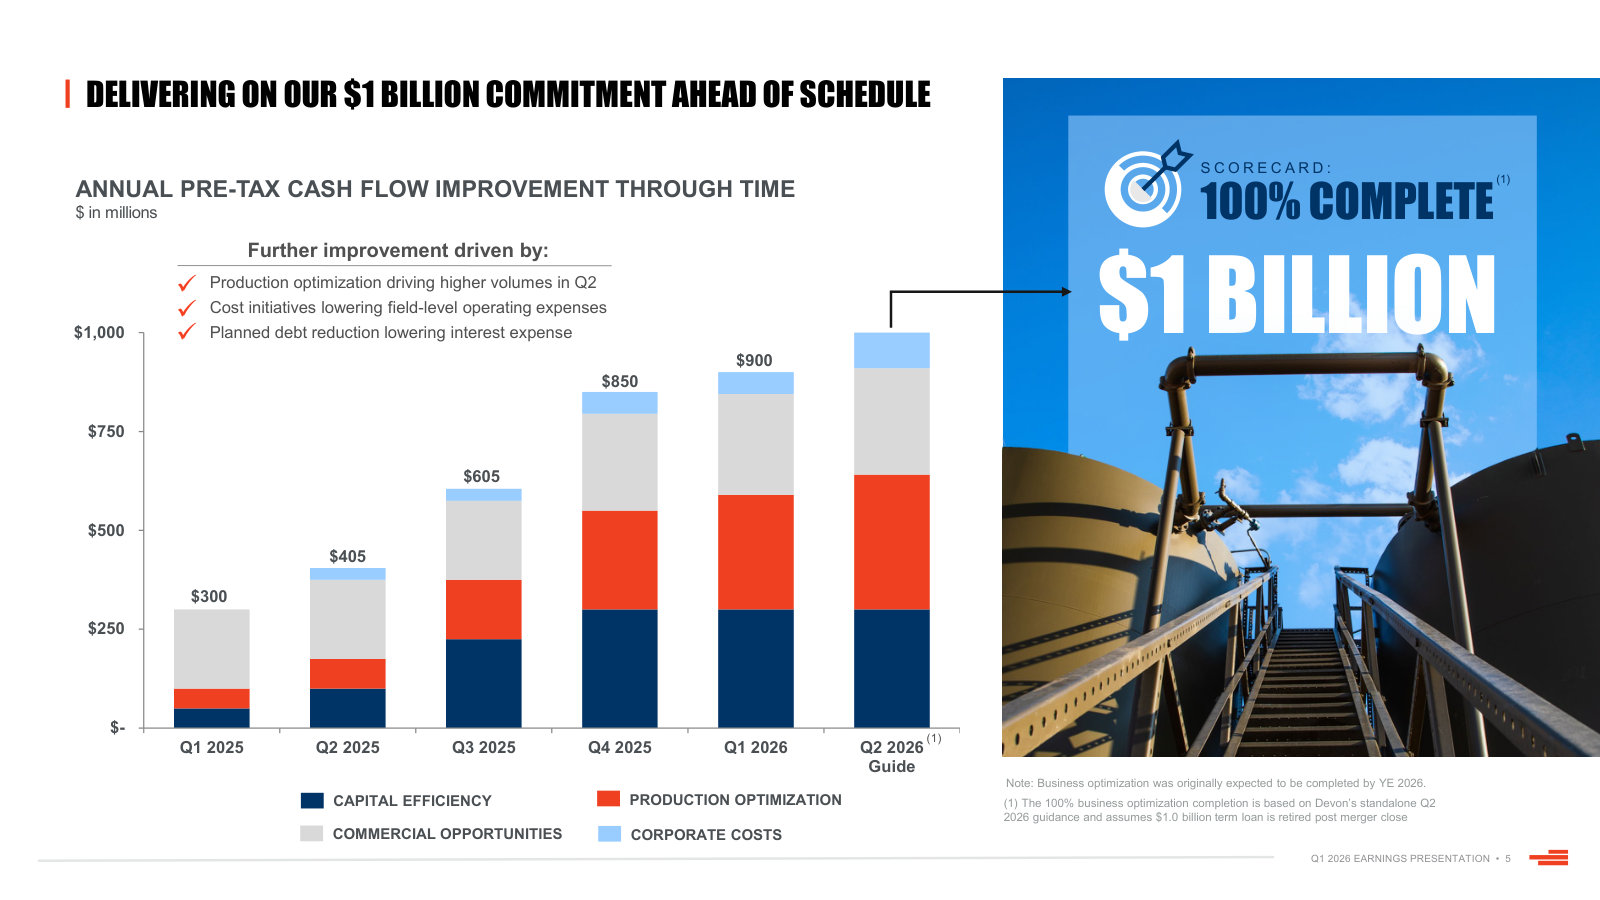
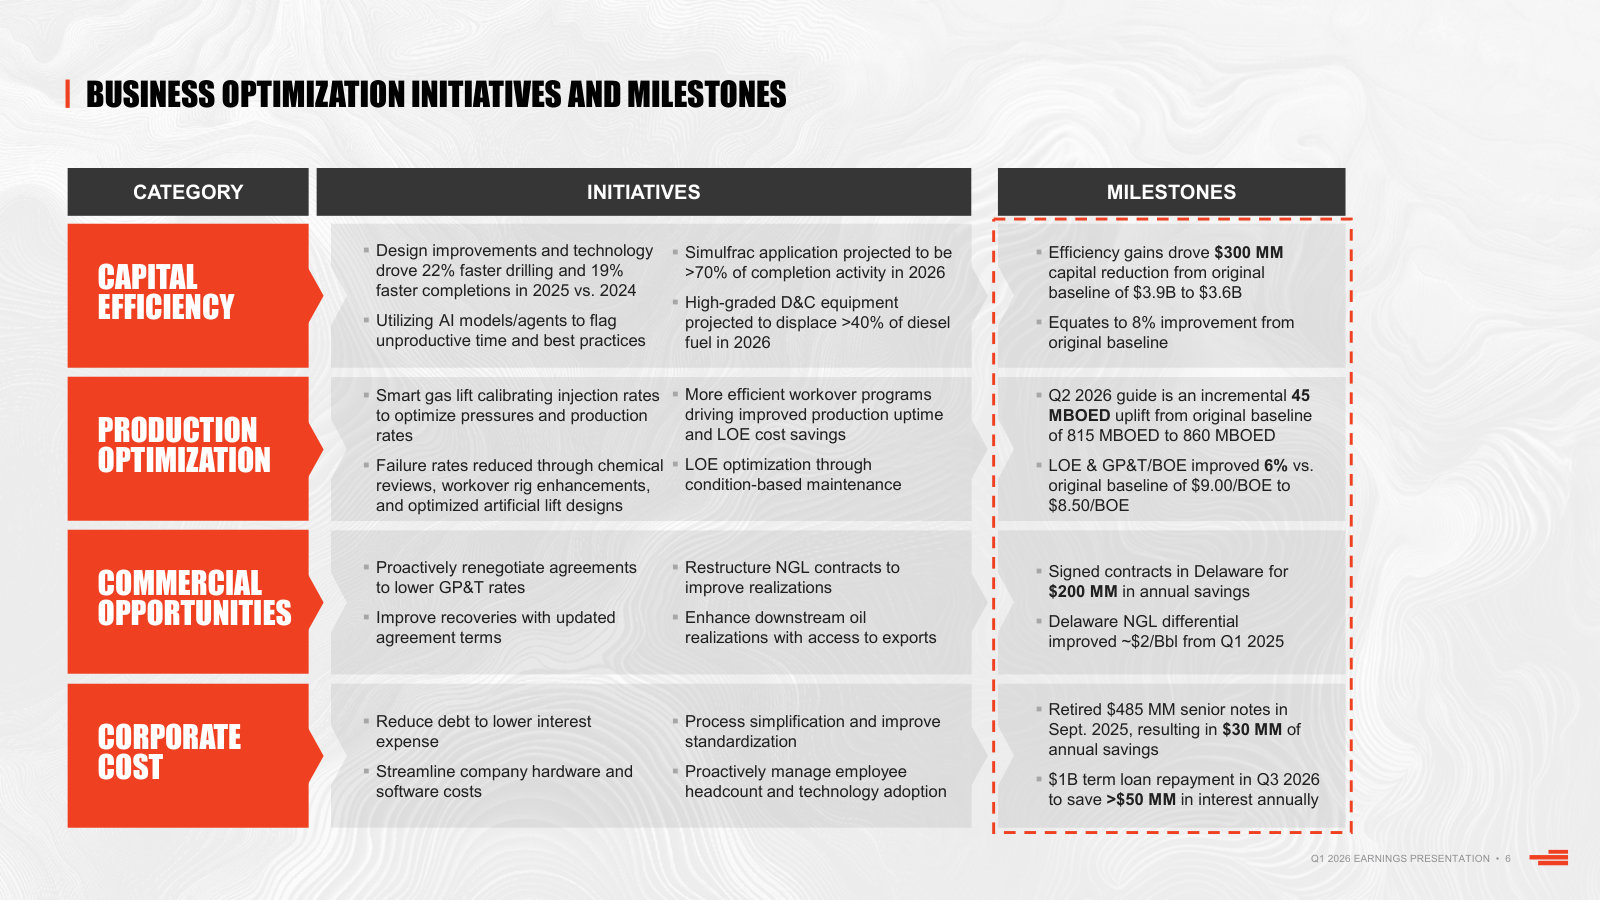
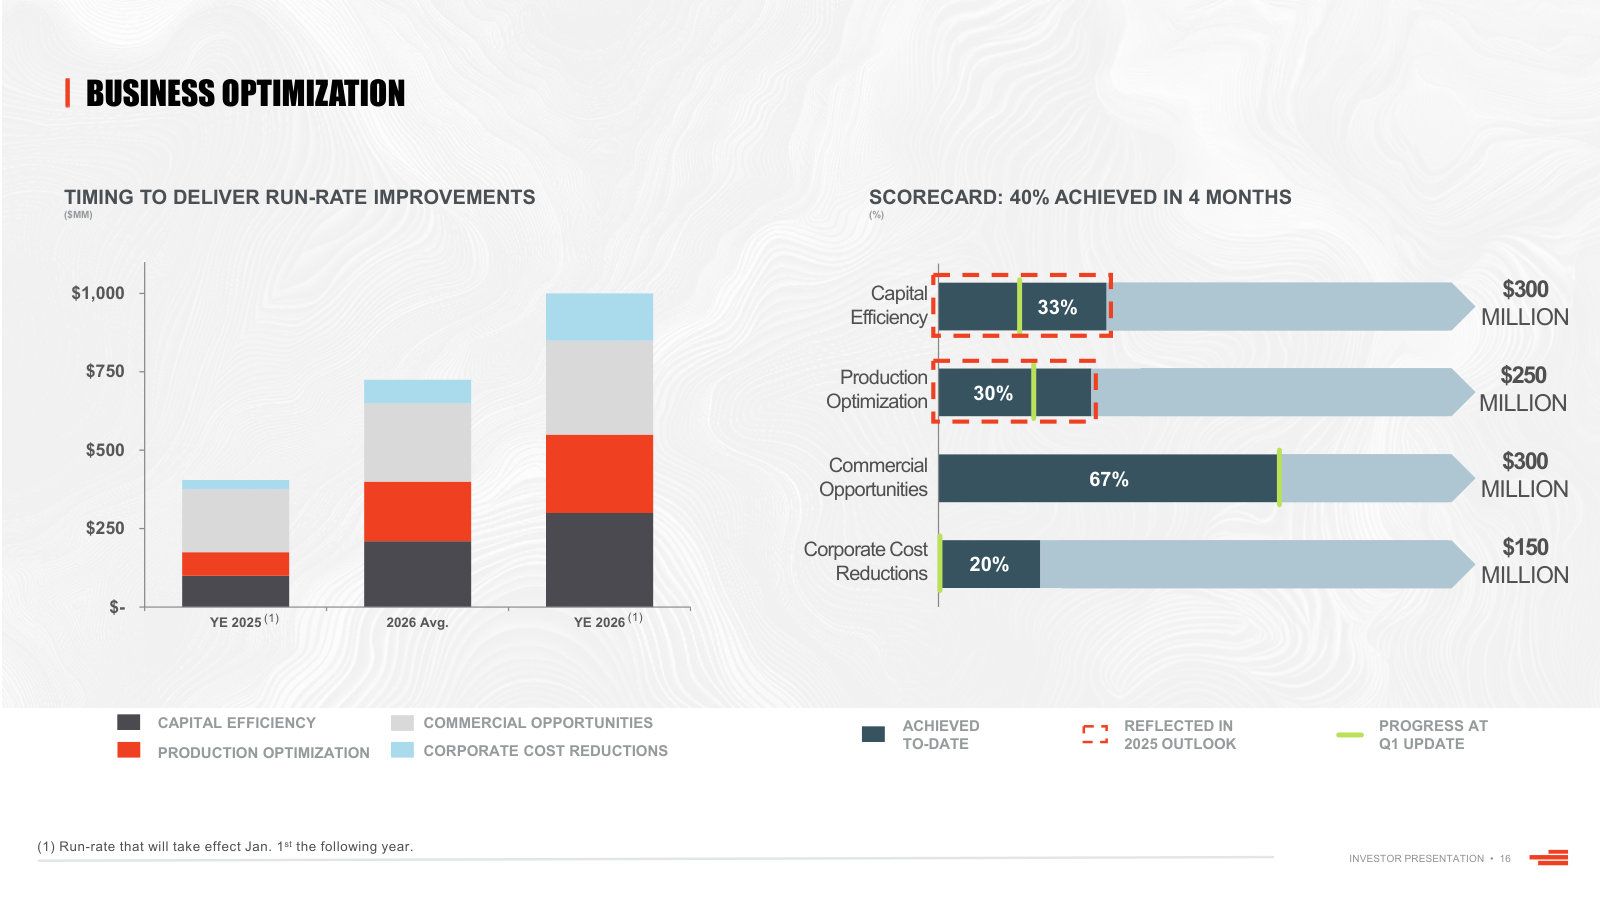
Jeffrey Ritenour (CFO): At our current valuation multiples, capitalizing on the after-tax impact of the targeted $1 billion of incremental free cash flow could translate to an estimated $10 per share in value, highlighting the significance of this work. […] Beginning at the top with capital efficiency, we are targeting $300 million of improvement by year-end 2026. These capital enhancements are structural and assume steady service and supply costs. Said another way, we have not assumed the benefit of any deflation from current price levels. Moving clockwise on the chart to production optimization, we expect to achieve $250 million of improvements by reducing downtime, flattening production declines and optimizing our operating cost structure. For commercial opportunities, our marketing team's contracting strategies are expected to deliver $300 million in total improvements by increasing realizations and lowering GP&T costs. And finally, corporate cost reductions are expected to be $150 million derived from lower interest expense, corporate capital, and G&A.
p. 3 · Read in context →
Midstream contract renegotiation explained: where the leverage came from and why fees on legacy NGL contracts halved.
Jeff Ritenour (CFO), answering Neil Mehta (Goldman Sachs): Frankly, that's where we have the absolute highest confidence because we already have those contracts executed. They are in place and they'll take effect at the end of this year and really into 2026, you'll get the full run rate benefit of that. Just to give you a little bit of color on what we've done there, so not a surprise to you, we have multiple midstream partners in the Delaware, in addition to the midstream infrastructure that we already own through our catalyst JV and our Cotton Draw midstream partnership. So that provides us a lot of leverage and opportunity and optionality, frankly to work with all of our partners and attempt to maximize margins. So, we had the benefit of a couple of contracts running their course as far as term over the next couple of years and we took advantage of the leverage that we have with our partners to really go in and look at how we could renegotiate those contracts and drive lower costs. So, it's a combination of lower fees, higher recoveries. The bulk of that is related to NGLs, our NGL business in the Delaware. But bottom line, we've reduced our fees. In some cases, we had legacy contracts that were 2x of what we expect to move forward with going forward. So, we've managed to reduce our fees on the gathering processing, transportation, and fractionation. And again, all that will take effect at the beginning of 2026. So, feel really confident in our ability to deliver on those outcomes.
p. 4 · Read in context →
Pressed to lean into a cheap stock, the CFO holds the framework fixed — steady buyback, fixed dividend, cash to the balance sheet.
Scott Hanold (RBC); Jeff Ritenour (CFO): Would it be wise to consider increasing buybacks in the short term and make use of some of that free cash flow strategically? […] At this point, we feel very committed to not changing our game plan. So, you're going to continue to see us execute on the $200 million to $300 million range of share repo each quarter. Obviously, the fixed dividend is in place, we expect to grow that annually. And then any incremental free cash flow that comes back to the balance sheet, we're going to use that to bolster our liquidity and then ultimately pay down our debt over time. So, no change to our financial framework at this point in time.
p. 8 · Read in context →
Which basins would actually flex if prices fell — the PRB as the marginal investment, the Delaware as the return anchor.
Clay Gaspar (President and CEO), answering Betty Jiang (Barclays): To give you an example, in the Powder River Basin, the economics are quite challenging as it's still in the early stages of development. We're focused on reducing costs and enhancing productivity and consistency, and we're seeing significant progress. This operational momentum has been achieved with just one rig. Although this area presents the toughest single well rate of return, it also has significant upside potential for value creation through continued investment and leveraging our strong position there. However, we are cautious and will reevaluate as prices approach the low $50s, ensuring that our actions align with the organization's best interests. […] In contrast, the Delaware Basin has the highest return rates. We have the flexibility to adjust operations, includin reducing rig counts and pacing our fracking schedules, which allows us to maintain high productivity and extend our inventory.
p. 11 · Read in context →
Q3 2024 Earnings Conference Call — Q3 2024
Where Devon set aside the variable dividend that had defined its shareholder-return model, and defended both its inventory depth and the price it paid for Grayson Mill. · Open the full transcript →
The variable dividend is shelved and the payout framework restated: up to 70% of free cash flow, weighted to buybacks.
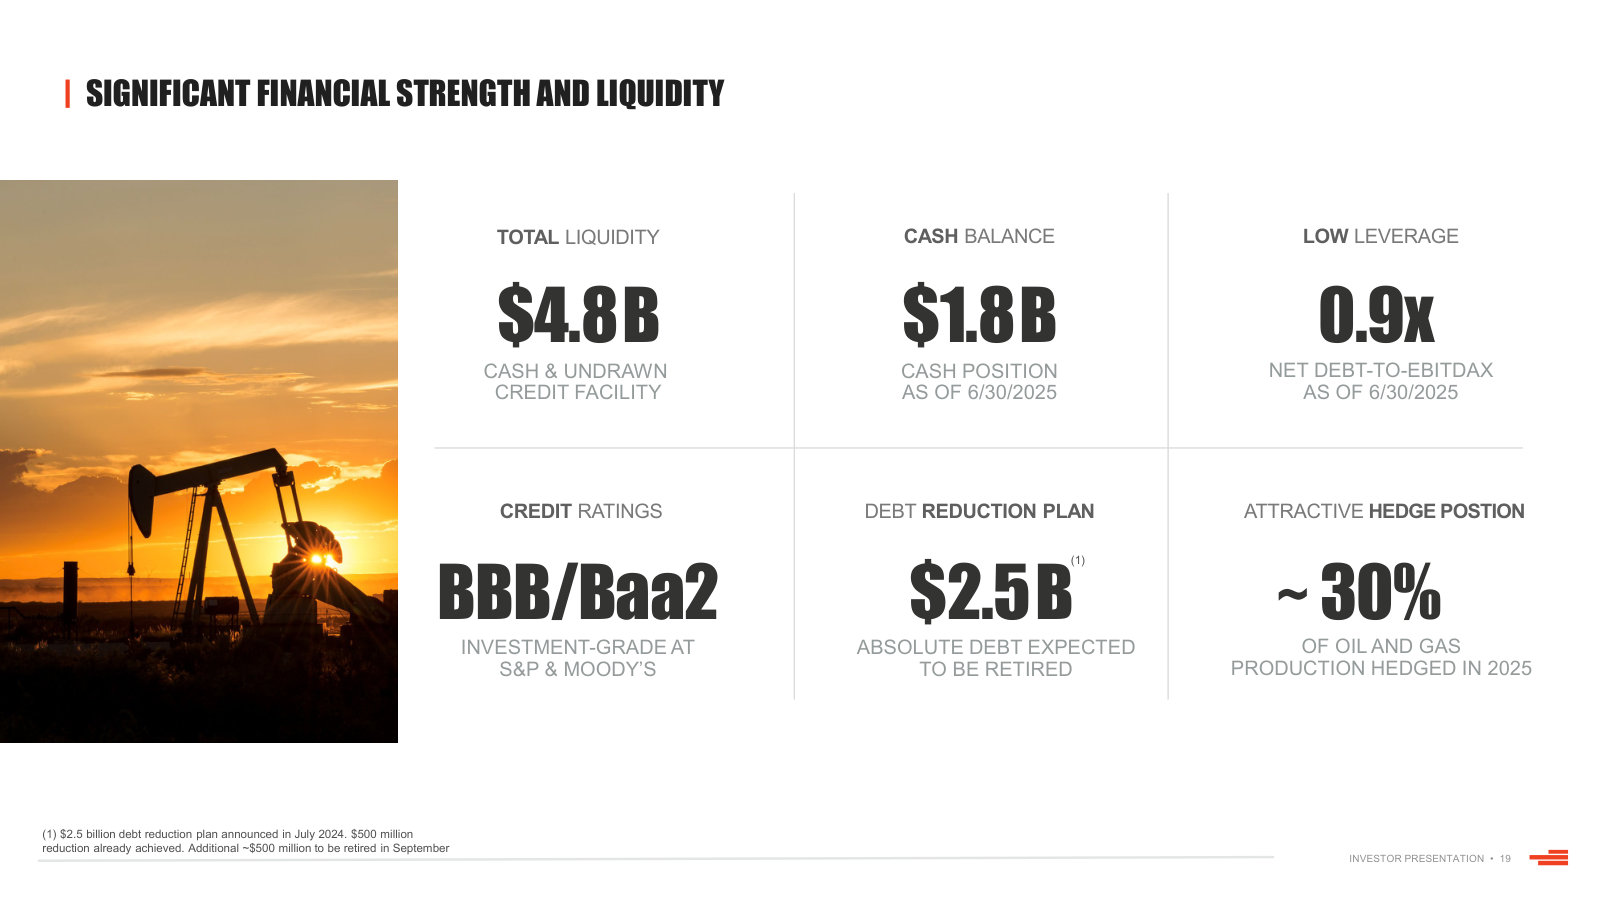
Jeffrey Ritenour (CFO): We elected not to pay a variable dividend this quarter. The variable dividend will remain a tool within our cash return framework, but in the near term, we expect to deliver cash returns to shareholders through our fixed dividend and share repurchase program. Foregoing the variable enabled us to reduce net leverage in pursuit of our $2.5 billion debt reduction target. […] We will continue targeting up to 70% of our free cash flow as a cash payout for shareholders and make progress on our $2.5 billion debt reduction program. We expect share repurchases in the range of $200 million to $300 million each quarter and we'll retain free cash flow beyond our share repurchases on the balance sheet to reduce our net leverage.
p. 3 · Read in context →
The reasoning behind the shift: a variable dividend is an above-mid-cycle tool, buybacks are the below-mid-cycle one.
Jeff Ritenour (CFO), answering Neal Dingmann (Truist): Our top priority regarding cash returns is the fixed dividend. Currently, we are very comfortable with our fixed dividend given our business model, and we expect to increase it as we approach next year. After finalizing our budget with the Board, we plan to announce growth in the fixed dividend after the first of the year. This is our first priority. In addition, we have consistently indicated our preference for share repurchases over the past several quarters. We believe our equity holds significant intrinsic value currently and from a long-term perspective. Therefore, we will continue to focus on the share repurchase program. Historically, we have also paid a variable dividend, which was influenced by market dynamics characterized by above mid-cycle pricing, and it worked well for us. However, due to the recent decline in commodity prices, we believe it is more sensible to eliminate the variable dividend for the short term and intensify our share repurchases and the growth of our fixed income capital. This will be our strategic approach moving forward. Of course, if market dynamics change, we will adjust our strategy accordingly, but we feel that is the strength of our financial framework, providing us with the flexibility needed to navigate the dynamic environment we are currently facing.
p. 8 · Read in context →
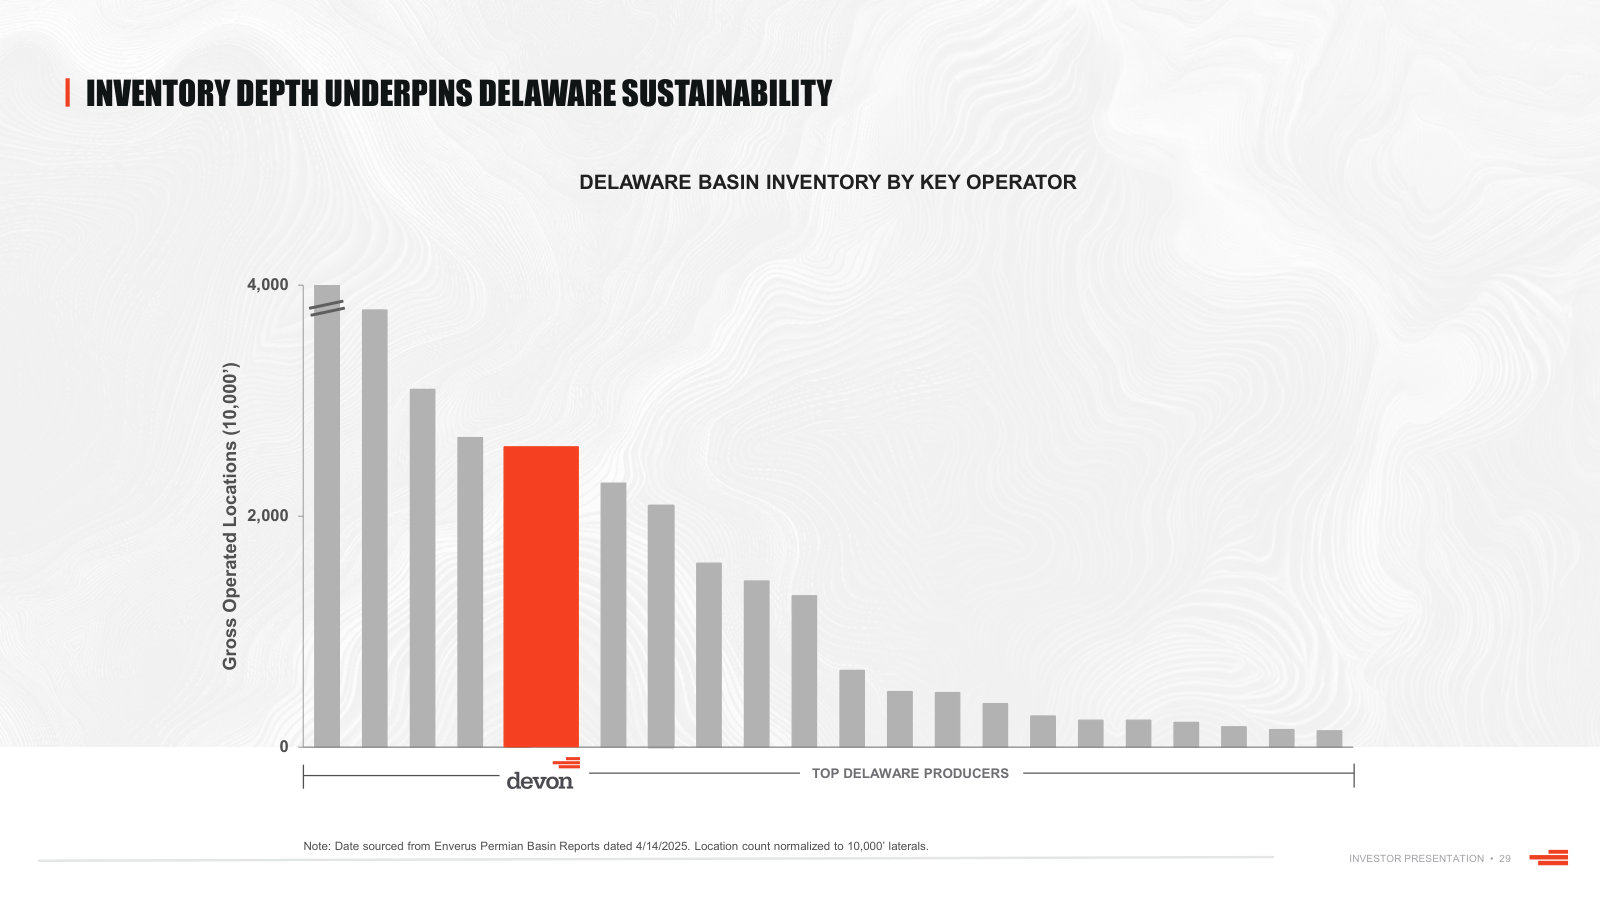
The inventory answer in full: ten years across five basins, with the front five derisked and the back five a bet on innovation.
Clay Gaspar (COO), answering Paul Cheng (Scotiabank): Yes, that's a great question about inventory. We appreciate the opportunity to discuss it because it's often misunderstood. We have strong support for our numbers from third-party sources like Enverus. We are confident in having a 10-year outlook across all five of our basins, with some like the Powder River Basin even extending further. In the Delaware Basin, which is our core area, we also have a solid outlook. There is a clear distinction between the front five years and the back five years, and we have much more confidence in the early period. The overall productivity and capital efficiency for our organization look promising for that first five years, which we consider to be derisked and well-aligned with our current operations. This provides us with five additional years to innovate and improve efficiency for the latter half of that period. That's why I am so confident in our stated 10-year outlook. Moreover, there is potential beyond that timeframe, as indicated by Rick over here, who is a strong advocate for our ongoing innovations, whether it's in deeper zones or geologic adjacencies. There is still significant opportunity to explore.
p. 9 · Read in context →
Why debt paydown outranked a bigger buyback with $8 billion of debt and a backwardated curve.
Doug Leggate (Wolfe Research); Jeff Ritenour (CFO): First, Jeff, when you mention the 70% free cash return, the buybacks, and the upcoming dividend increase, I am curious about your decision to avoid the variable due to your concerns regarding commodities. Given that your capital structure still has $8 billion in debt and a backward-dated oil curve, why is the balance sheet receiving more focus than the buyback, especially considering the oil price uncertainty you discussed this morning? […] We have the advantage of a strong balance sheet and good liquidity, along with a business model that allows for low breakeven points, so we don't feel the need to rush into aggressive debt repayment. We're trying to balance this with the value we see in our equity. As I mentioned earlier, our flexible framework enables us to pursue both goals effectively. We believe we can grow the fixed dividend, buy back our shares at what we consider a discounted price, and meet our debt reduction targets over time. If the market deteriorates further, we will reconsider our approach and make necessary adjustments, but we are quite comfortable with our current plan.
p. 9 · Read in context →
Asked whether Grayson Mill still works at a lower strip, the CEO marks the deal to the stock and defends the mid-cycle case.
Doug Leggate (Wolfe Research); Rick Muncrief (President and CEO): Rick, you mentioned in your prepared remarks that there’s over a decade of inventory. I realize there isn’t a specific figure, but we had significantly higher oil prices when you made that $5 billion acquisition. Considering the current forward strip, how do you assess the value of the forward free cash flow asset compared to your plans when you completed the deal? I'll leave it at that. […] The bottom line is we were around $75, $76 when we completed that transaction. It's important to always consider the long-term outlook for commodity prices. None of us have unrealistic expectations. There are people predicting $4.50 gas prices by year's end, but that seems unlikely now. Having been in this business for a long time, you know that predicting commodity prices is one of the more challenging tasks we face. However, eventually, you have to commit to a direction. What we appreciate about Grayson Mill is that we felt very confident about the economics of the transaction, particularly regarding mid-cycle prices, which may be a bit lower than current levels. We structured the deal with two-thirds debt and one-third equity. The team performed admirably, securing a fixed number of shares. Now that commodity prices have declined and equity prices have rebounded, the $5 billion headline number at the close of the transaction is closer to 4.6% or 4.7% from that perspective. This is how we see it. We are very satisfied with the transaction and optimistic about our long-term inventory. The Bakken is a fantastic reservoir, and the Williston Basin has been a significant energy source for many years. We are pleased with our position and have no regrets at all. We feel very positive about it.
p. 10 · Read in context →
Q2 2024 Earnings Conference Call — Q2 2024
The Grayson Mill call: what Devon thought it was buying in the Bakken, the bar any deal has to clear, and the sharpest airing of the bear case on Delaware inventory. · Open the full transcript →
The Grayson Mill rationale — scale in the Williston, ten years of Bakken inventory, and a buyback raised 67% alongside it.
Rick Muncrief (President and CEO): Upon completion of the transaction, Devon will be one of the largest oil producers in the U.S. with average daily rates estimated at around 375,000 barrels of oil per day. This transaction nearly triples our production and expands our inventory in the Williston Basin. At the current pace of development, we have about 10 years of Bakken project inventory. This vast improvement in operating scale place Devon in a great position to harvest high-margin production from this prolific oilfield for many years to come. […] We see significant financial value created from this acquisition. We expect sustainable accretion to earnings and free cash flow. Given the strength of this transaction, we've expanded our share repurchase program by 67% to $5 billion. This increased authorization provides us ample capacity to continue to opportunistically repurchase our stock and bolster our per-share growth trajectory for the next few years.
p. 2 · Read in context →
Well-level economics, and a useful correction: faster cycle times show up in returns, not in the quarter's production line.
Clay Gaspar (Chief Operating Officer): The impact of drilling and completing a bit faster adds considerable value to each well's project economics, but this timing doesn't typically add much to an individual quarter's production. […] In aggregate, these projects achieved average 30-day rates of more than 2,800 BOE per day with recoveries projected to exceed $1.3 million BOE per well. With improving well costs and impressive performance, I'm confident that this batch of high-impact projects is delivering some of the best returns in the entire U.S.
p. 2 · Read in context →
The fixed-plus-variable dividend model at work, plus how the $5 billion acquisition was financed and what it did to leverage.
Jeff Ritenour (Chief Financial Officer): Consistent with our disciplined cash return framework, we returned approximately 70% of excess free cash flow to shareholders through a combination of buybacks and dividends. Given the compelling valuation of our equity, cash returns are skewed towards share repurchases over the variable dividend. We bought back 5.2 million shares for $256 million during the quarter. In addition to our share repurchase program, our Board declared a fixed-plus-variable dividend payout of $0.44 per share. This distribution will be paid at the end of September. Overall, we believe the flexibility of our cash return strategy provides us the opportunity to return meaningful and appropriate amounts of cash to shareholders across a variety of market conditions through the cycle. […] Turning to our balance sheet, we'll fund the Grayson Mill acquisition with $3.25 billion of cash and $1.75 billion of stock. For the cash portion, we expect to use a combination of cash on hand, shorter-duration term loans, and long-term notes. Moving forward, we'll look to build upon our financial strength and will initiate a $2.5 billion debt reduction program.
p. 4 · Read in context →
Guidance philosophy: why Devon spent the plan and beat volumes instead of banking the efficiency as lower capital.
Neil Mehta (Goldman Sachs); Rick Muncrief (President and CEO): you could have throttled back the capital and hit the volume or you could have kept the capital the same and beat the volume guide. Can you walk us through the decision tree of - especially taking into account the macro, how you came to the decision to maintain the CapEx, but to focus more on the volume side? […] You know the reality is, I've seen time and time again over the last 40 years when you - things are looking good only to have some kind of a downstream constraint to surprise you, whatever it may be. So what w did is we decided volumes were looking really, really good. We stuck with our game plan, exceeded the expectations and - but we did have some discussion around that and - but we stuck with a plan, you saw the performance.
p. 5 · Read in context →
On the claim that half the Grayson acreage is non-core: why "Tier 2" migrates into core, and what Devon actually underwrites.
Charles Meade (Johnson Rice); Rick Muncrief (President and CEO): I've heard some people say, well, look at the math and they say a lot of that, particularly the Western portion is non-core. And so, I'm curious if you could - if you could give your comments on whether to what extent you agree with that? And maybe would say that was reflected in our purchase price or alternatively, whether that view is perhaps outdated, given that there hasn't been as much attention on the Bakken as there once was? […] That's something that I think we have seen over time is that with efficiencies, and cost control, and all the things that we've learned over the last 15 or 20 years in these shale plays what was once Tier 2 has become core. And I think that what we're seeing is some of this could arguably have been 15, 20 years ago, Tier 2 plus. What we're seeing is it's, I'd call it between Tier 2 and core. So, we're going to see some really nice returns. At the end of the day, when you start looking at the efficiencies, the fact that we're changing orientation slightly, we're drilling three-mile laterals, instead of twomile. We're drilling three-mile wells in the same time or less than it used to take us to drill to and completions with these efficiencies. What you see is at the end of the day, whether it's core, whether it's Tier 2, Tier 3, Tier 4, whatever it may be. At the end of the day, all comes down to well-level returns and what it does for your capital efficiency. And that's how we price all of our transactions
p. 12 · Read in context →
More calls
Q3 2025 Earnings Conference Call — Q3 2025 · 18 pages · Preliminary 2026 guidance and the business optimization plan crossing 60% of its target, one quarter before the Coterra deal reframed everything. · Open →
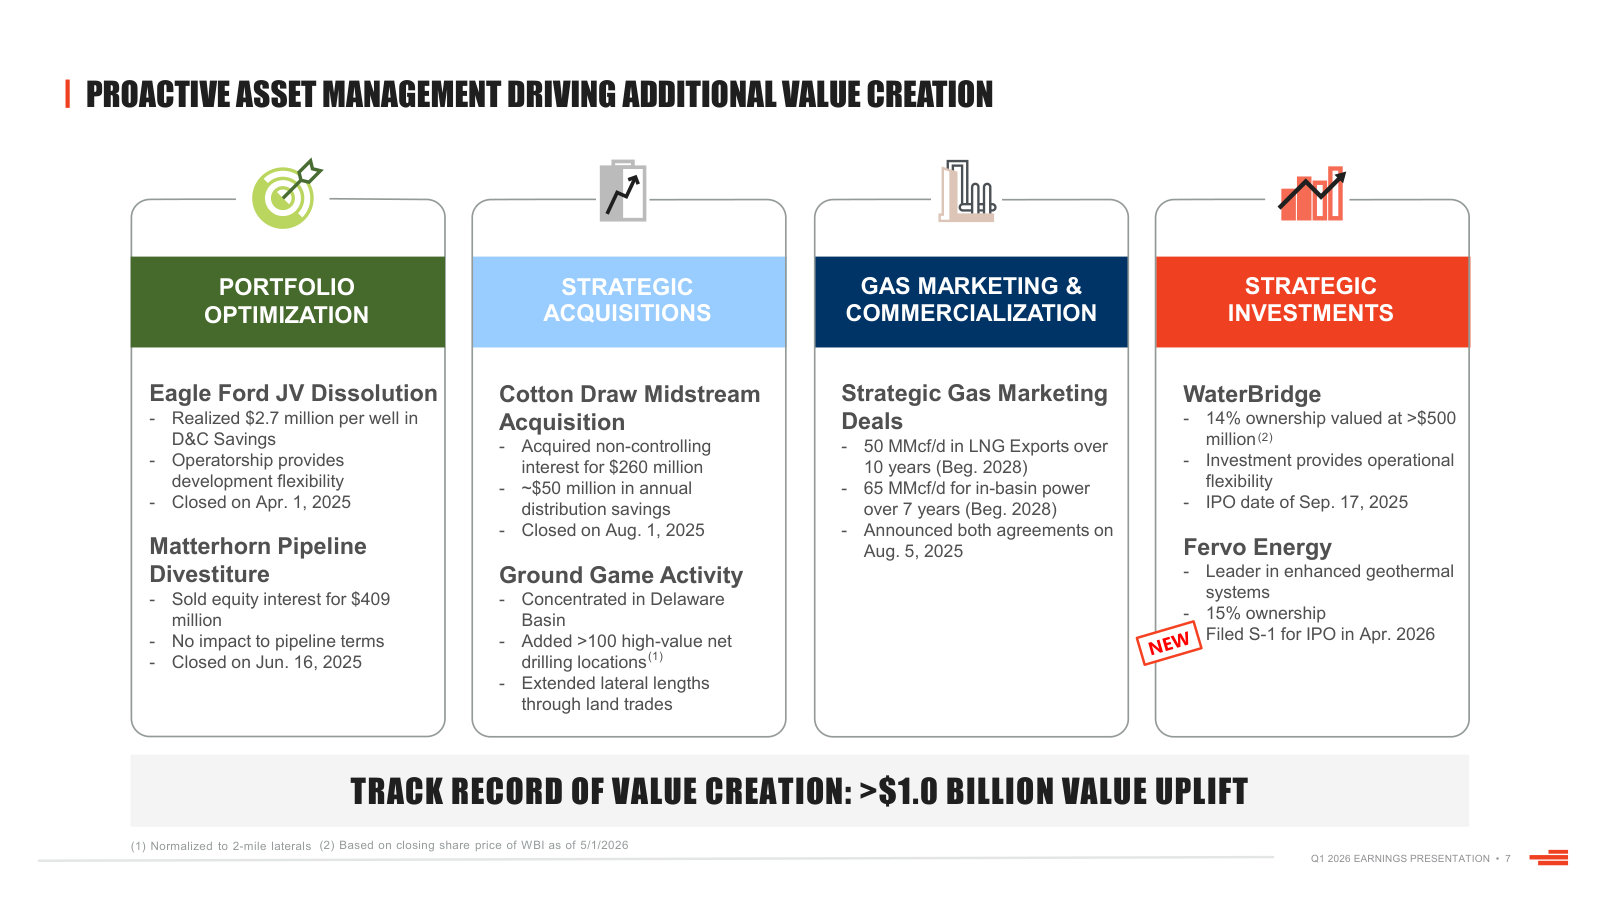
Q2 2025 Earnings Conference Call — Q2 2025 · 20 pages · The Matterhorn sale and the Cotton Draw buy-in, with the reasoning on when owning midstream helps the wells and when it is just trapped capital. · Open →
Q4 and Full-Year 2024 Earnings Conference Call — Q4 FY2024 · 22 pages · Rick Muncrief's handoff to Clay Gaspar, 2025 guidance in full, and the BPX Eagle Ford partnership dissolution that reset that asset's economics. · Open →
Q1 2024 Earnings Conference Call — Q1 2024 · 13 pages · The pre-Grayson baseline: a Delaware-led plan under the fixed-plus-variable dividend, useful for measuring what the acquisitions changed. · Open →
Q4 and Full-Year 2023 Earnings Conference Call — Q4 FY2023 · 12 pages · Go here for the 2024 budget as originally set and the state of the buyback-versus-variable-dividend debate before it was resolved. · Open →
Q4 and Full-Year 2022 Earnings Conference Call — Q4 FY2022 · 15 pages · The peak-cycle version of Devon: record variable dividends and the first serious analyst pressure on Delaware inventory depth. · Open →
Q2 2021 Earnings Conference Call — Q2 2021 · 13 pages · The early WPX-merger era, when the fixed-plus-variable dividend framework Devon pioneered was still being explained from scratch. · Open →
Devon Energy Corporation's annual reports contain management's most considered account of the business. These are the sections, passages and visual pages worth opening in the originals preserved in Sources.
Devon Energy Corporation — FY2025 Annual Report (Form 10-K) — FY2025
The last 10-K Devon filed as a standalone company: full-year 2025 results plus the Coterra merger of equals signed 17 days before filing. · Open the full document →
Items 1 and 2. Business and Properties — p. 10 · Read the full section →
Devon in its own words, and the five principles it says govern capital allocation through the price cycle.
The self-description and two of the five stated principles: asset quality and cash back to shareholders.
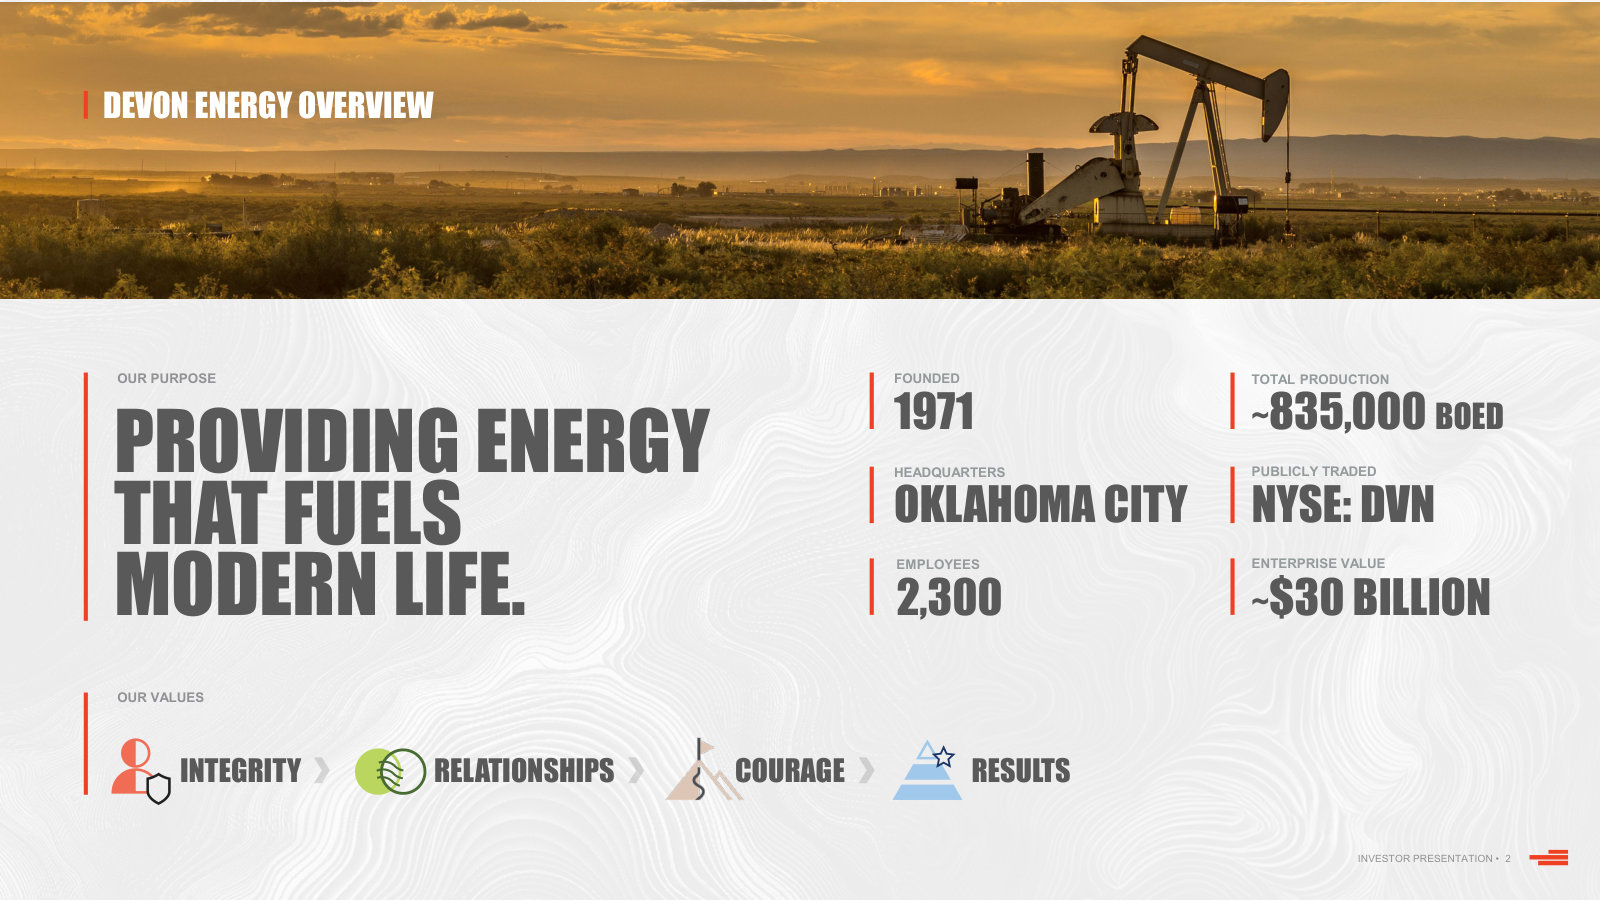
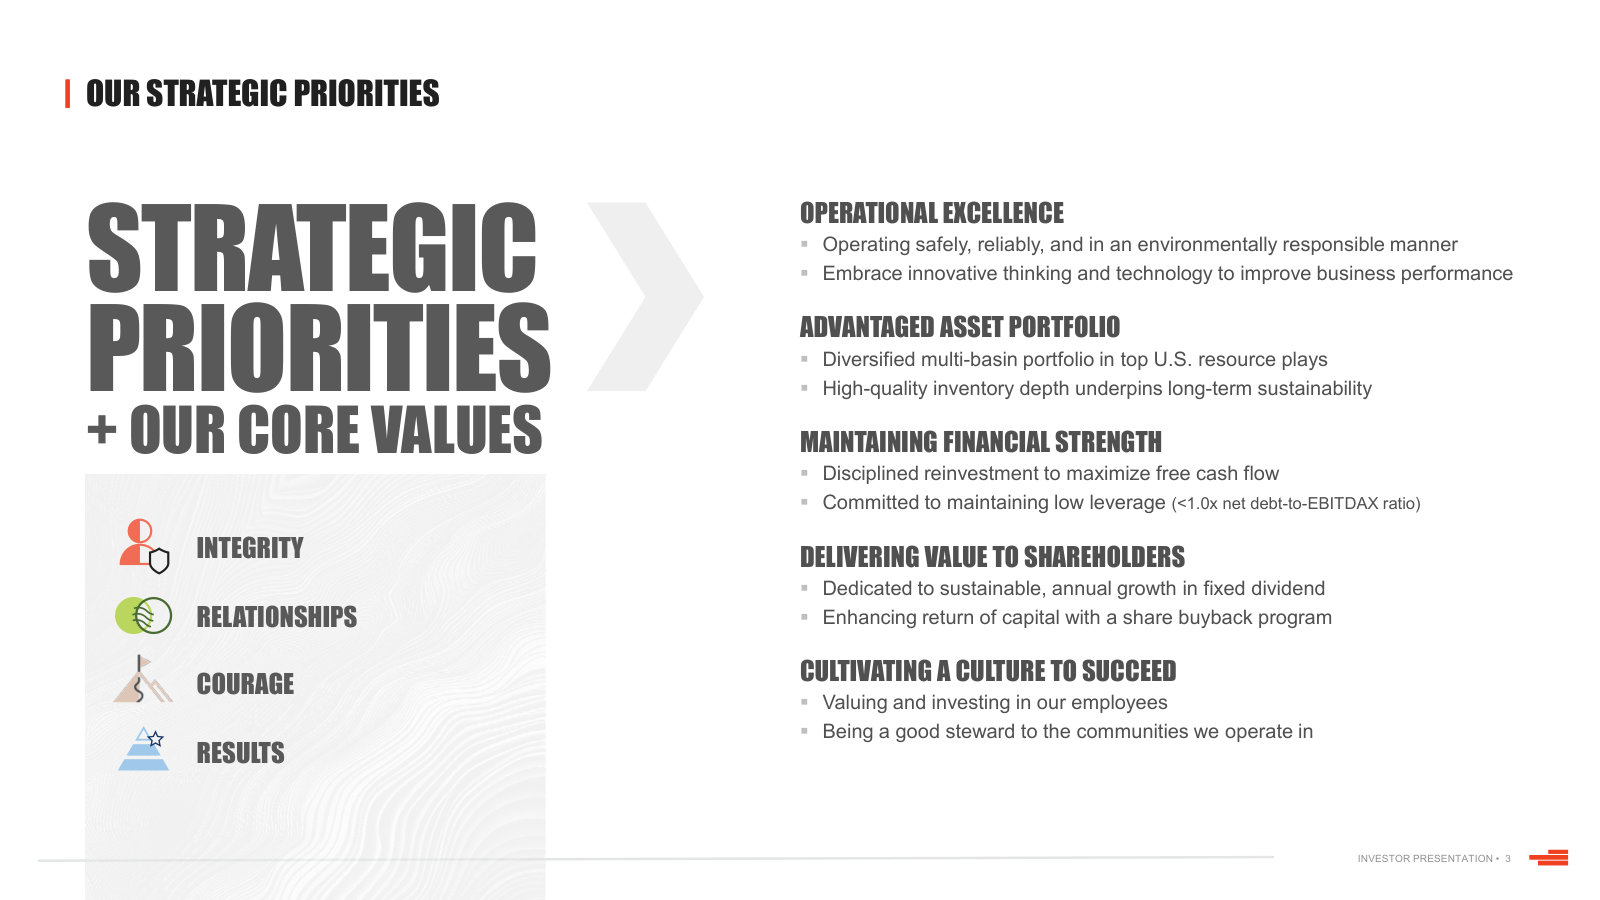
Founded in 1971 and publicly held since 1988, Devon (NYSE: DVN) is an independent energy company engaged primarily in the exploration, development and production of oil, natural gas and NGLs. Our operations are concentrated in various onshore areas in the U.S. […] Our business strategy is focused on delivering a consistently competitive shareholder return among our peer group. Because the business of exploring for, developing and producing oil and natural gas is capital intensive, delivering sustainable, capital efficient cash flow growth is a key tenet to our success. While our cash flow is highly dependent on volatile and uncertain commodity prices, we pursue our strategy throughout all commodity price cycles with five fundamental principles. […] Advantaged asset portfolio – We believe U.S. crude oil and natural gas will continue to be advantaged in the global energy markets. As discussed in more detail later in this section, we own a portfolio of assets located in the Delaware Basin, Rockies, Eagle Ford and Anadarko Basin. We strive to own premier assets capable of generating cash flows in excess of our capital and operating requirements, as well as competitive rates of return. […] Delivering value to shareholders – We are committed to shareholder returns. We are dedicated to a growing fixed dividend that is sustainable through the commodity price cycles. We adhere to distributing our cash flows in excess of operating and capital needs to shareholders.
p. 10 · Read in context →
Oil and Gas Properties — Property Profiles — p. 16 · Read the full section →
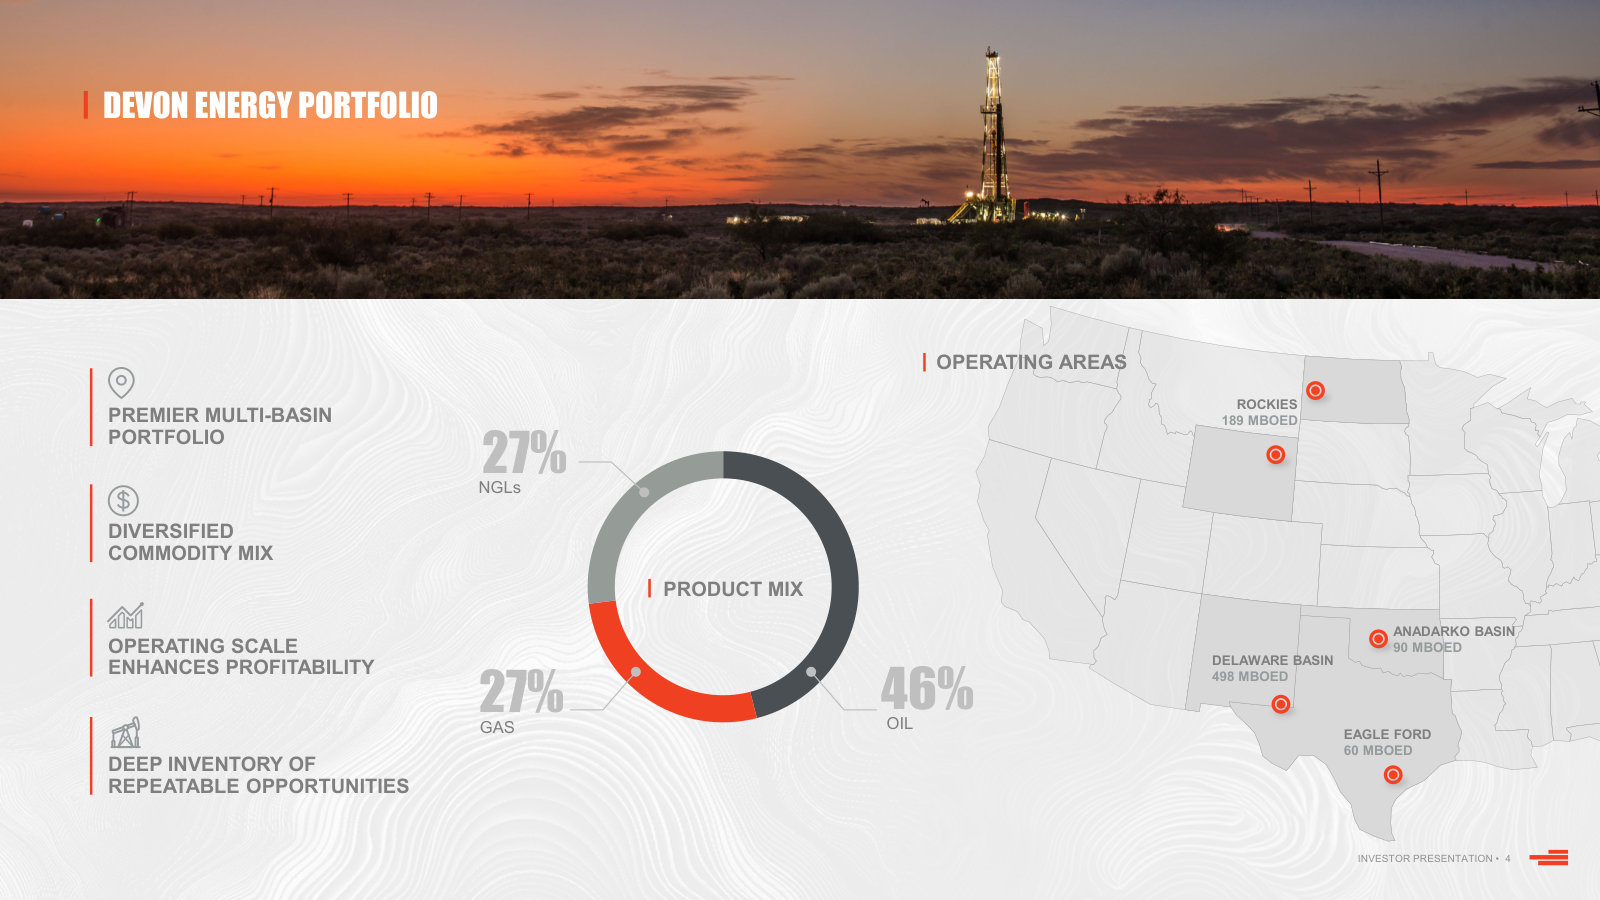
One page fixes where the barrels come from: Delaware Basin is 59% of production and 56% of proved reserves.
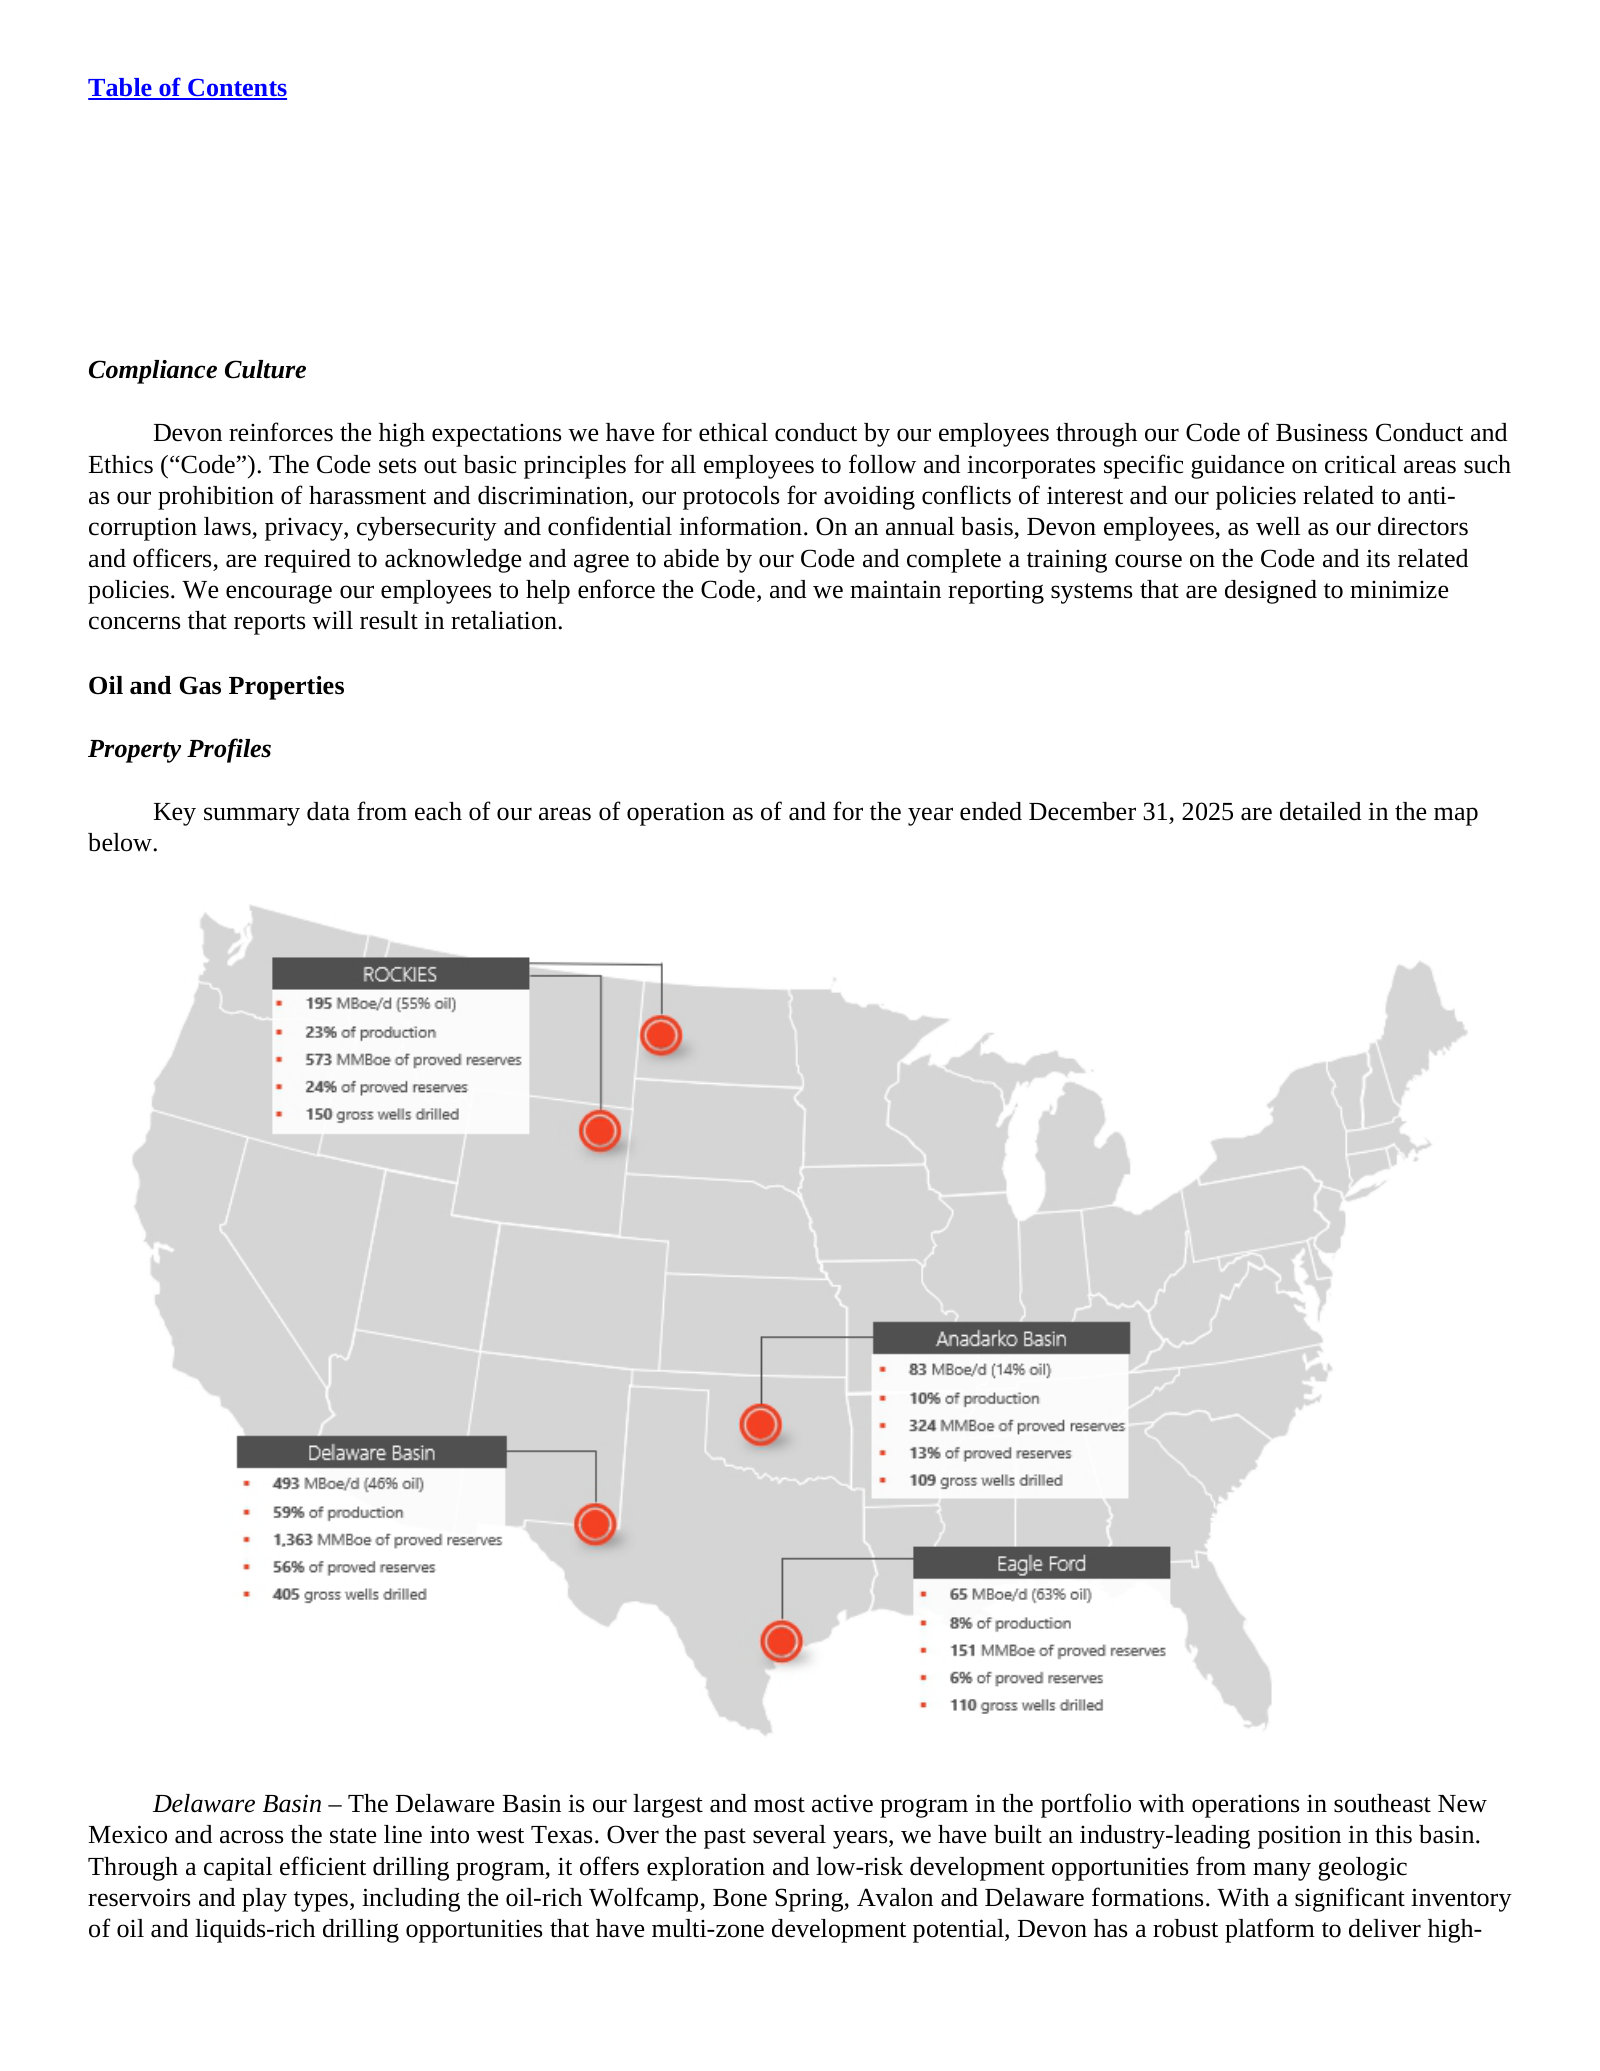
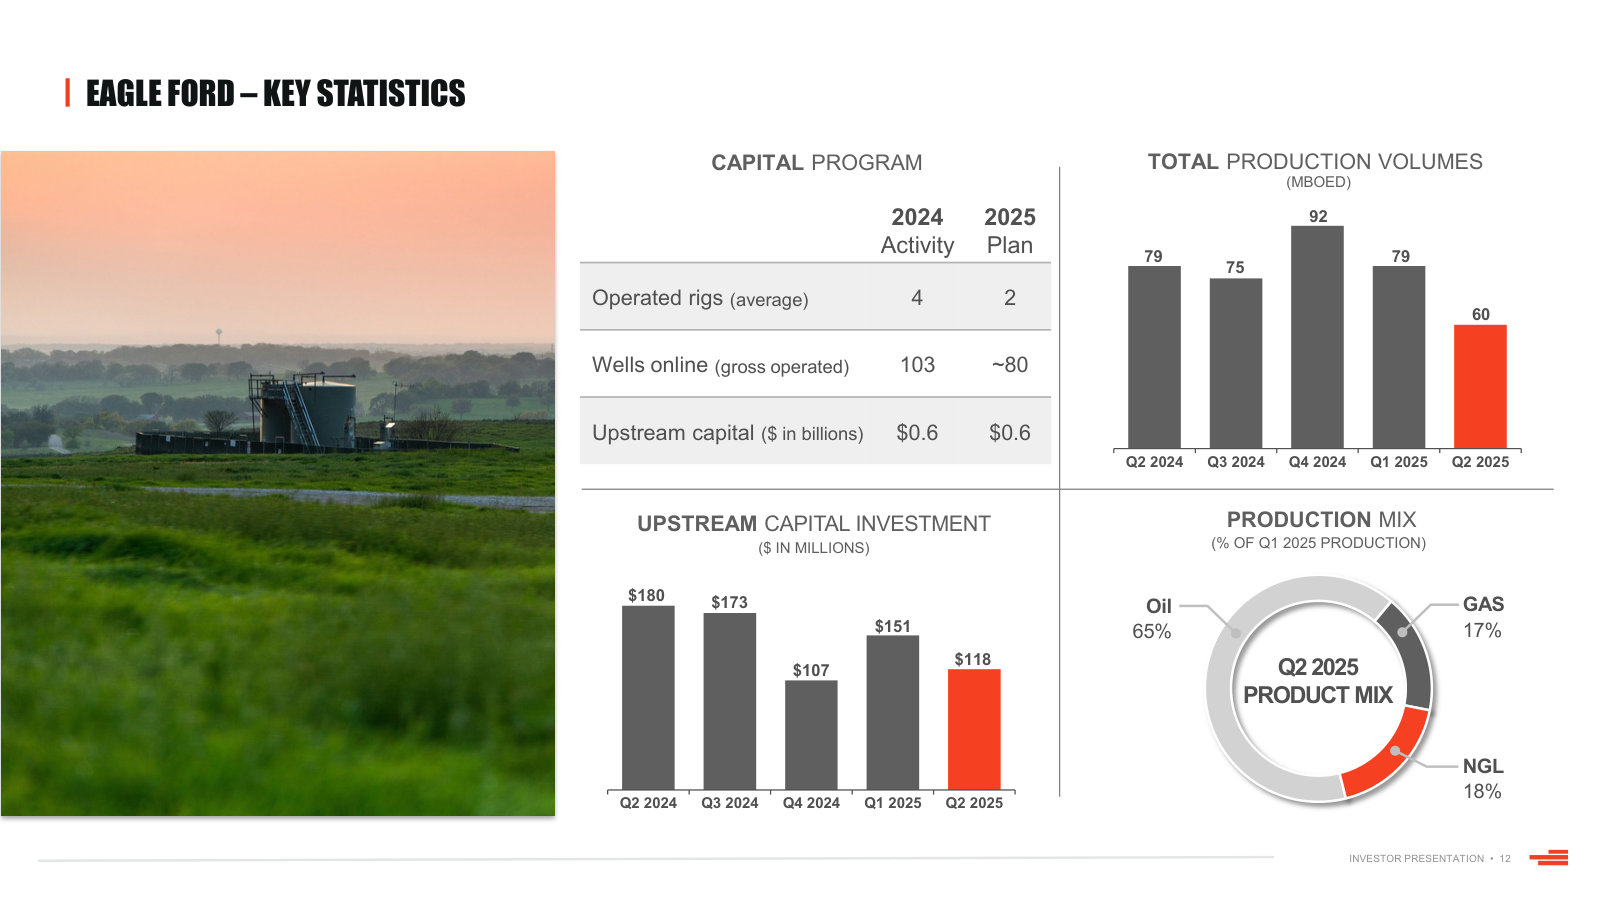
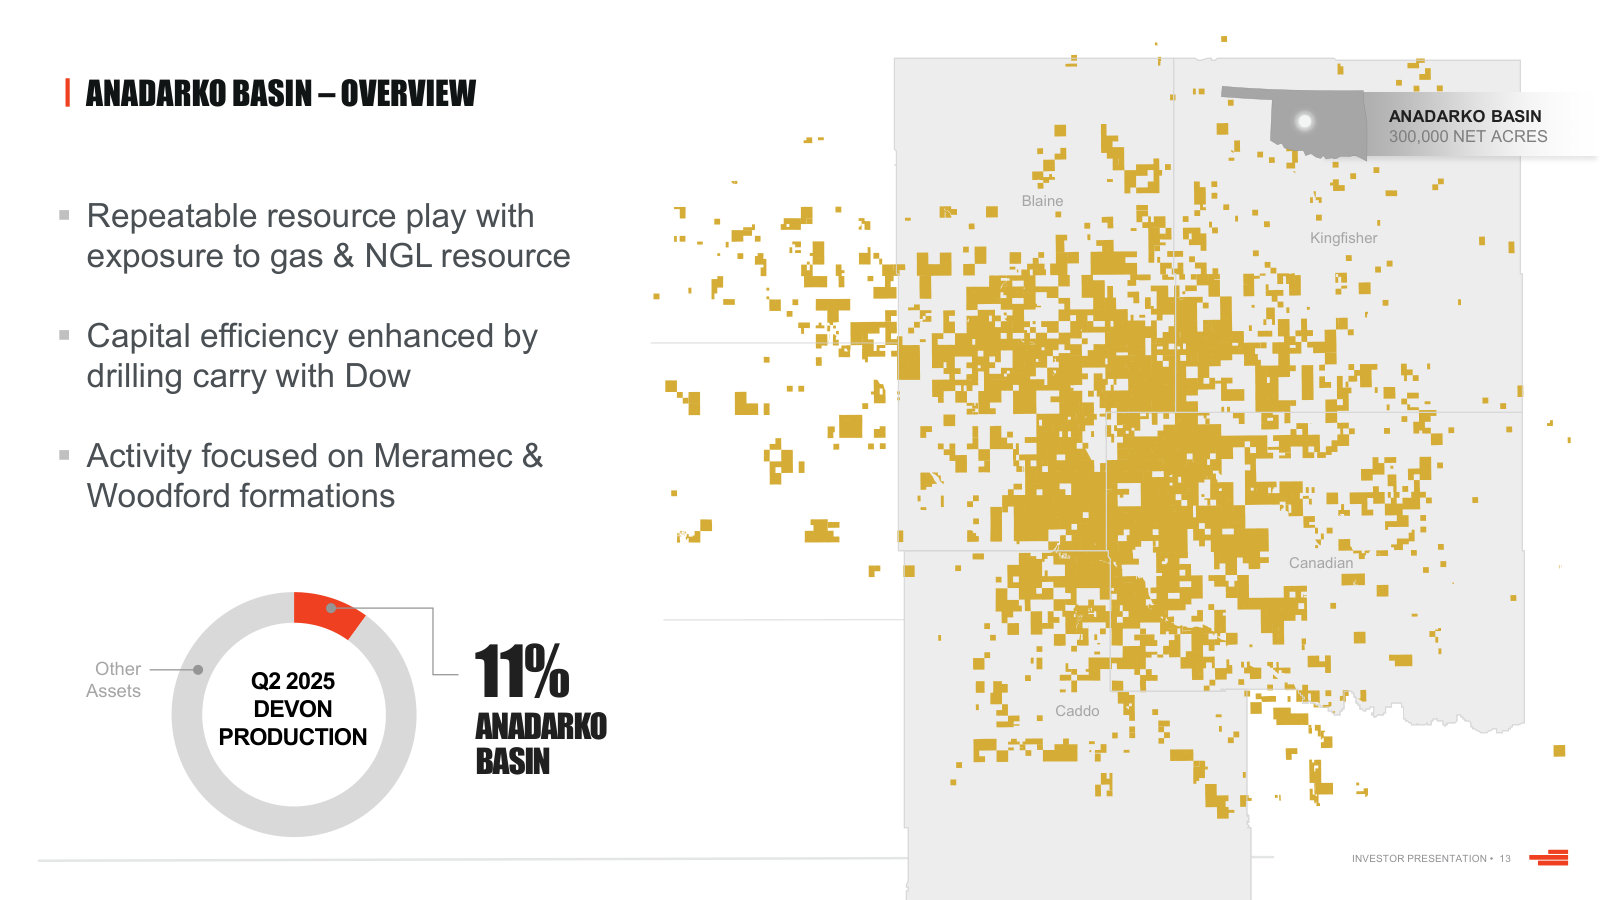
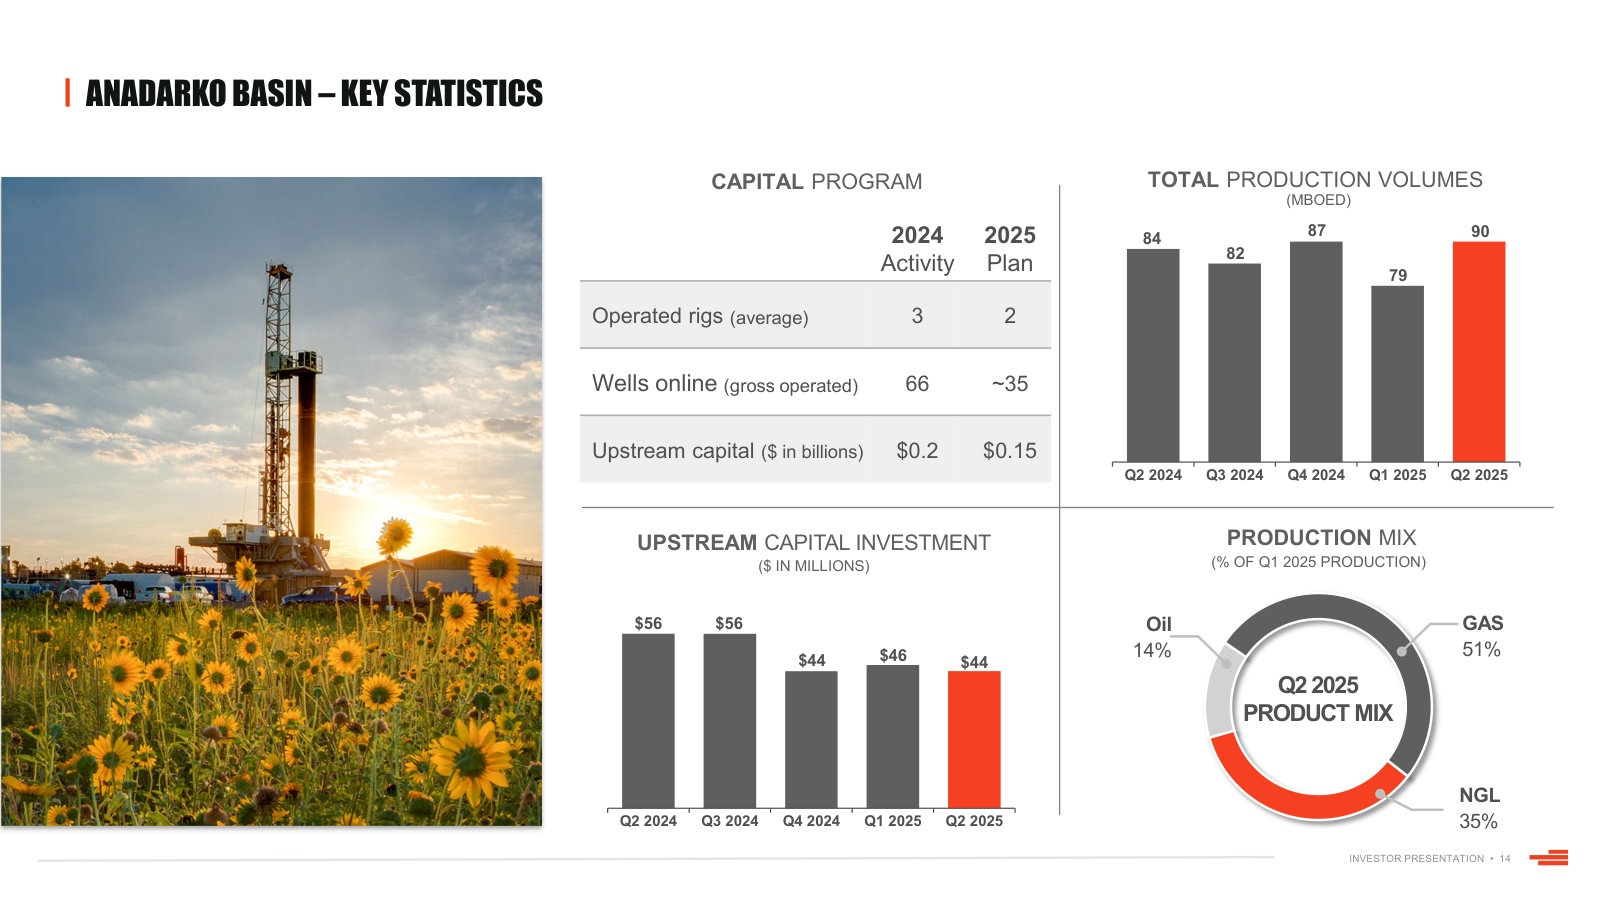
The three non-Delaware areas: Grayson Mill rebuilt the Rockies, BPX split the Eagle Ford, Dow co-funds the Anadarko.
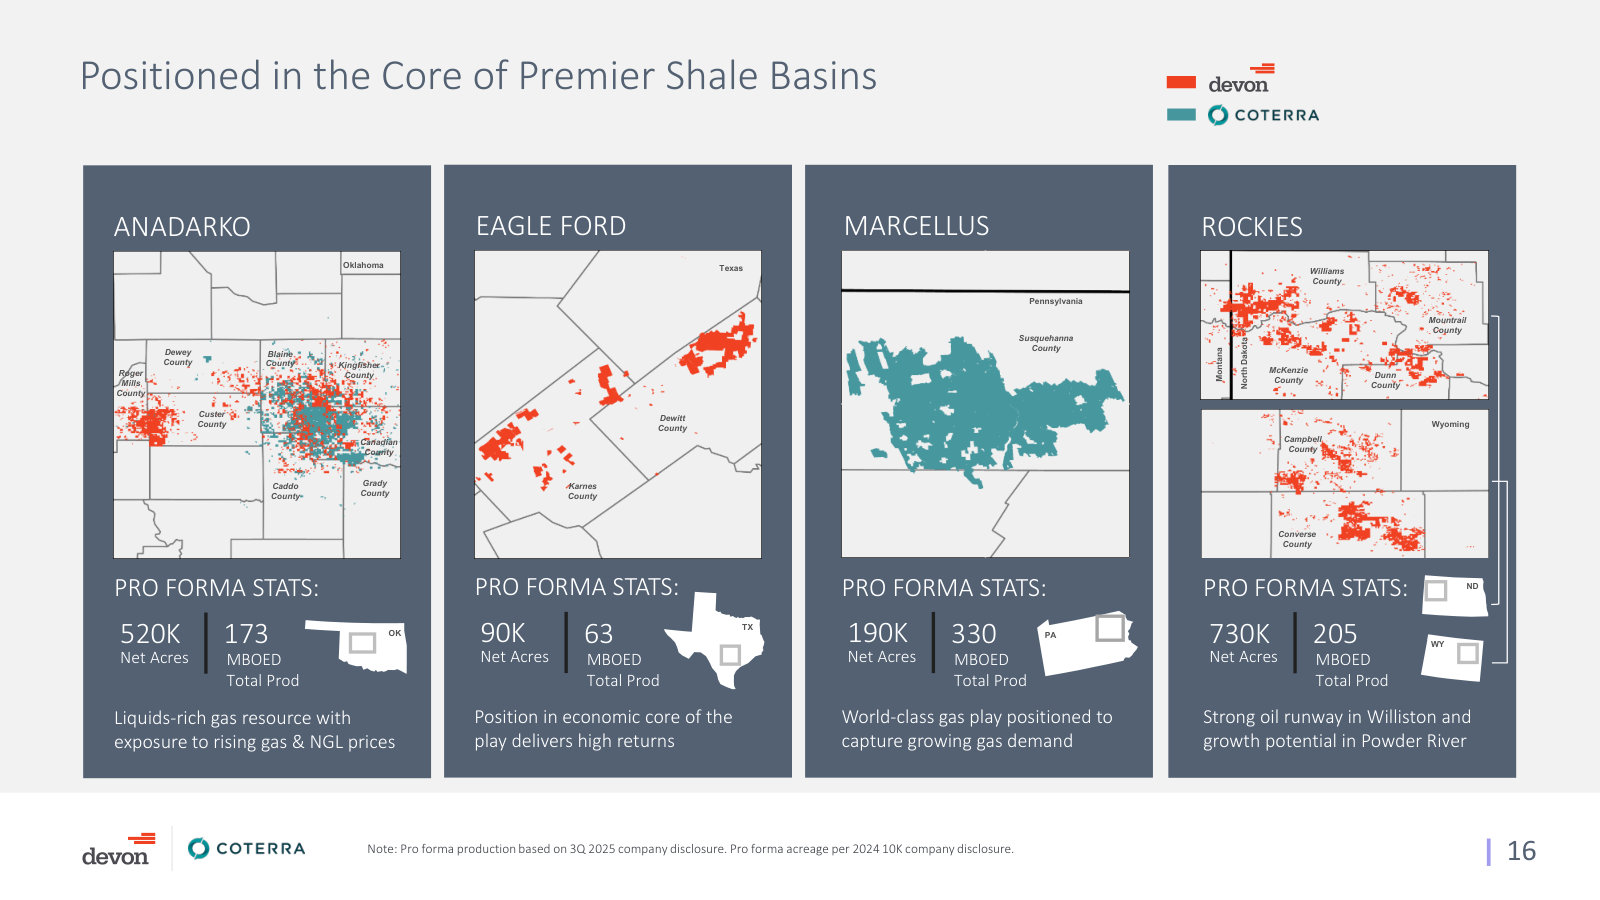
Rockies – Our Rockies development consists of our Williston Basin and Powder River Basin assets. Our position within these oilweighted basins provides us with a deep inventory of high-margin opportunities. […] Through the Grayson Mill acquisition, we significantly expanded our operating position within the basin. […] Eagle Ford – Our Eagle Ford operations are located in Texas' DeWitt and Karnes counties, situated in the economic core of this south Texas play. Its production is leveraged to oil and has low-cost access to premium Gulf Coast pricing, providing for strong operating margins. On April 1, 2025, Devon and BPX Energy dissolved their partnership and divided their acreage in the Eagle Ford Blackhawk field located in Texas' DeWitt County, resulting in increased operational flexibility for both parties. […] Anadarko Basin – Our Anadarko Basin development, located in western Oklahoma, is one of the largest in the industry, providing substantial long-term inventory optionality. We have an agreement with Dow to jointly develop a portion of our Anadarko Basin acreage and, as of December 31, 2025, we had a two rig program associated with this joint venture.
p. 18 · Read in context →
Midstream Capacity Constraints and Interruptions Impact Commodity Sales — p. 33 · Read the full section →
Devon's gas realized 49% of Henry Hub in 2025 and Williston gas realized below zero; takeaway is where that value goes.
Risks Relating to the Merger — p. 41 · Read the full section →
A new risk category in this edition: the whole Coterra thesis rests on $1.0bn of synergies, and the deal could still have broken.
Integration risk, with the planned dividend increase and buyback authorization explicitly conditioned on realizing synergies.
The success of the Merger will depend on, among other things, the combined company’s ability to realize anticipated synergies and benefits. If the combined company is not able to successfully achieve these synergies, or the cost to achieve these synergies is greater than expected, then the anticipated benefits of the Merger may not be realized fully or at all or may take longer to realize than expected. Moreover, if we do not realize such benefits or for any other reason, the board of directors of the combined company may not approve, or delay the approval of, the anticipated increases in our dividends and share repurchase authorization following the Merger, which could negatively impact our stock price.
p. 41 · Read in context →
Item 7. Management's Discussion and Analysis — Executive Overview — p. 55 · Read the full section →
Management's own framing of the two years that reshaped the company: Grayson Mill, then Coterra, with a cost plan in between.
The $5.0bn Grayson Mill purchase, the Coterra merger of equals, and the $1.0bn business optimization plan.
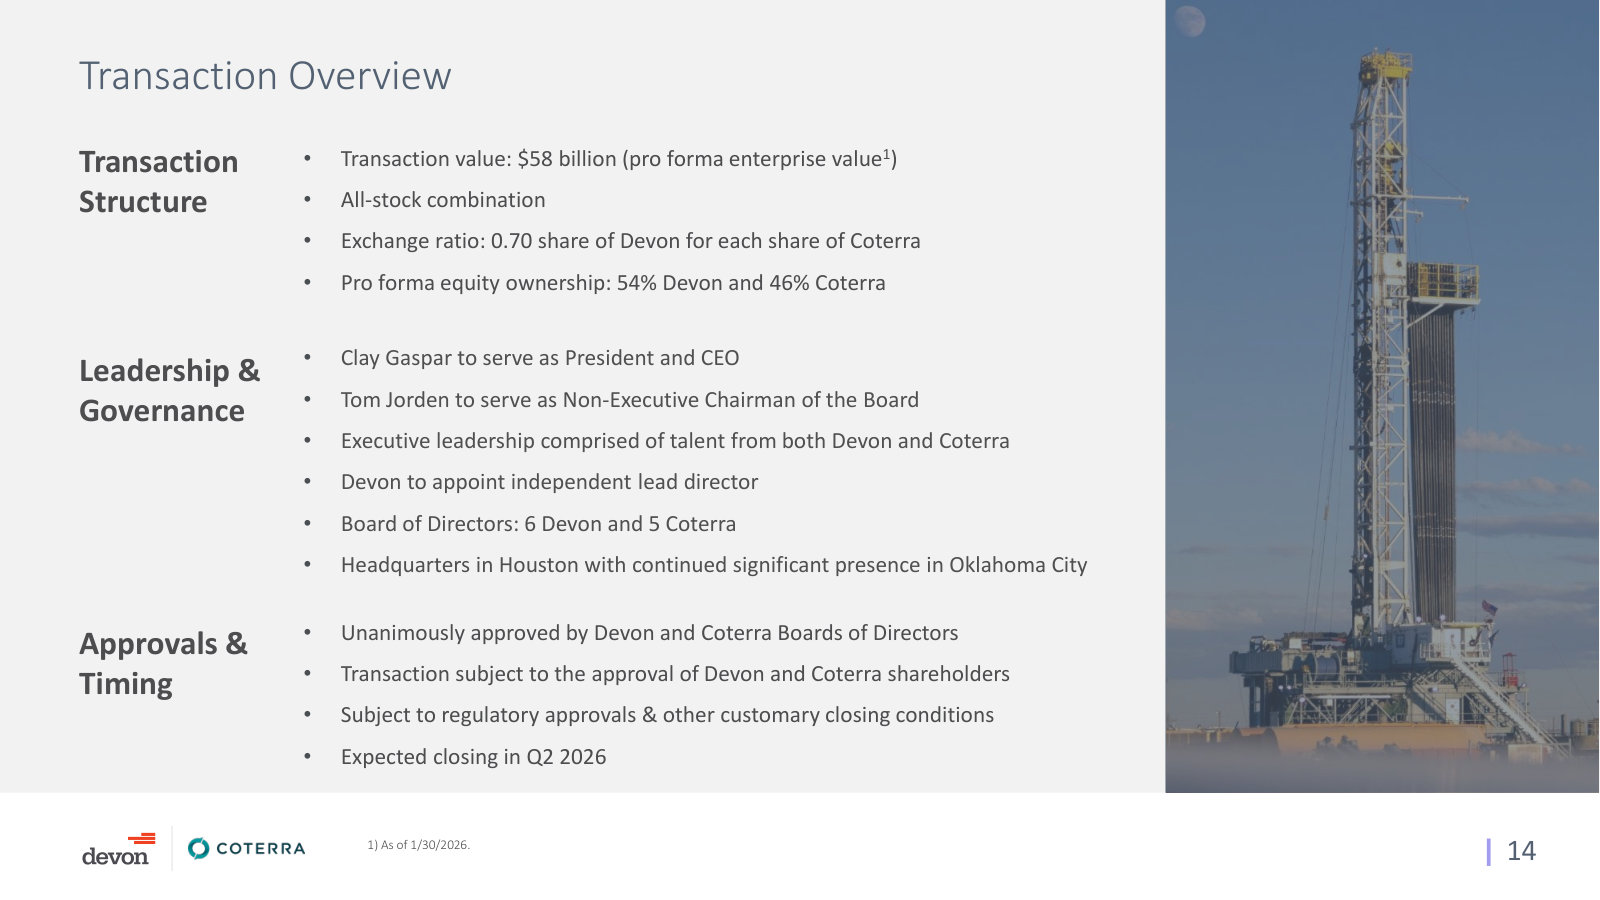
On September 27, 2024, we acquired the Williston Basin business of Grayson Mill for total consideration of approximately $5.0 billion, consisting of $3.5 billion of cash and approximately 37.3 million shares of Devon common stock, including purchase price adjustments. […] On February 1, 2026, we entered into the Merger Agreement, providing for an all-stock merger of equals with Coterra. The Merger will create a leading large-cap shale operator with an asset base anchored by a premier position in the economic core of the Delaware Basin. The Merger is expected to unlock substantial value for shareholders by leveraging enhanced scale to improve margins, increase free cash flow and accelerate cash returns through the capture of $1.0 billion in sustainable annual synergies. […] To emphasize our commitment to maximizing free cash flow and creating value for shareholders, we have implemented a business optimization plan which is anticipated to improve our annual pre-tax cash flow by $1.0 billion. The plan includes actions to achieve more efficient field-level operations and improvements in drilling and completion costs while improving operating margins and corporate costs. These savings are on track to be achieved by the end of 2026 with approximately $850 million achieved through 2025.
p. 55 · Read in context →
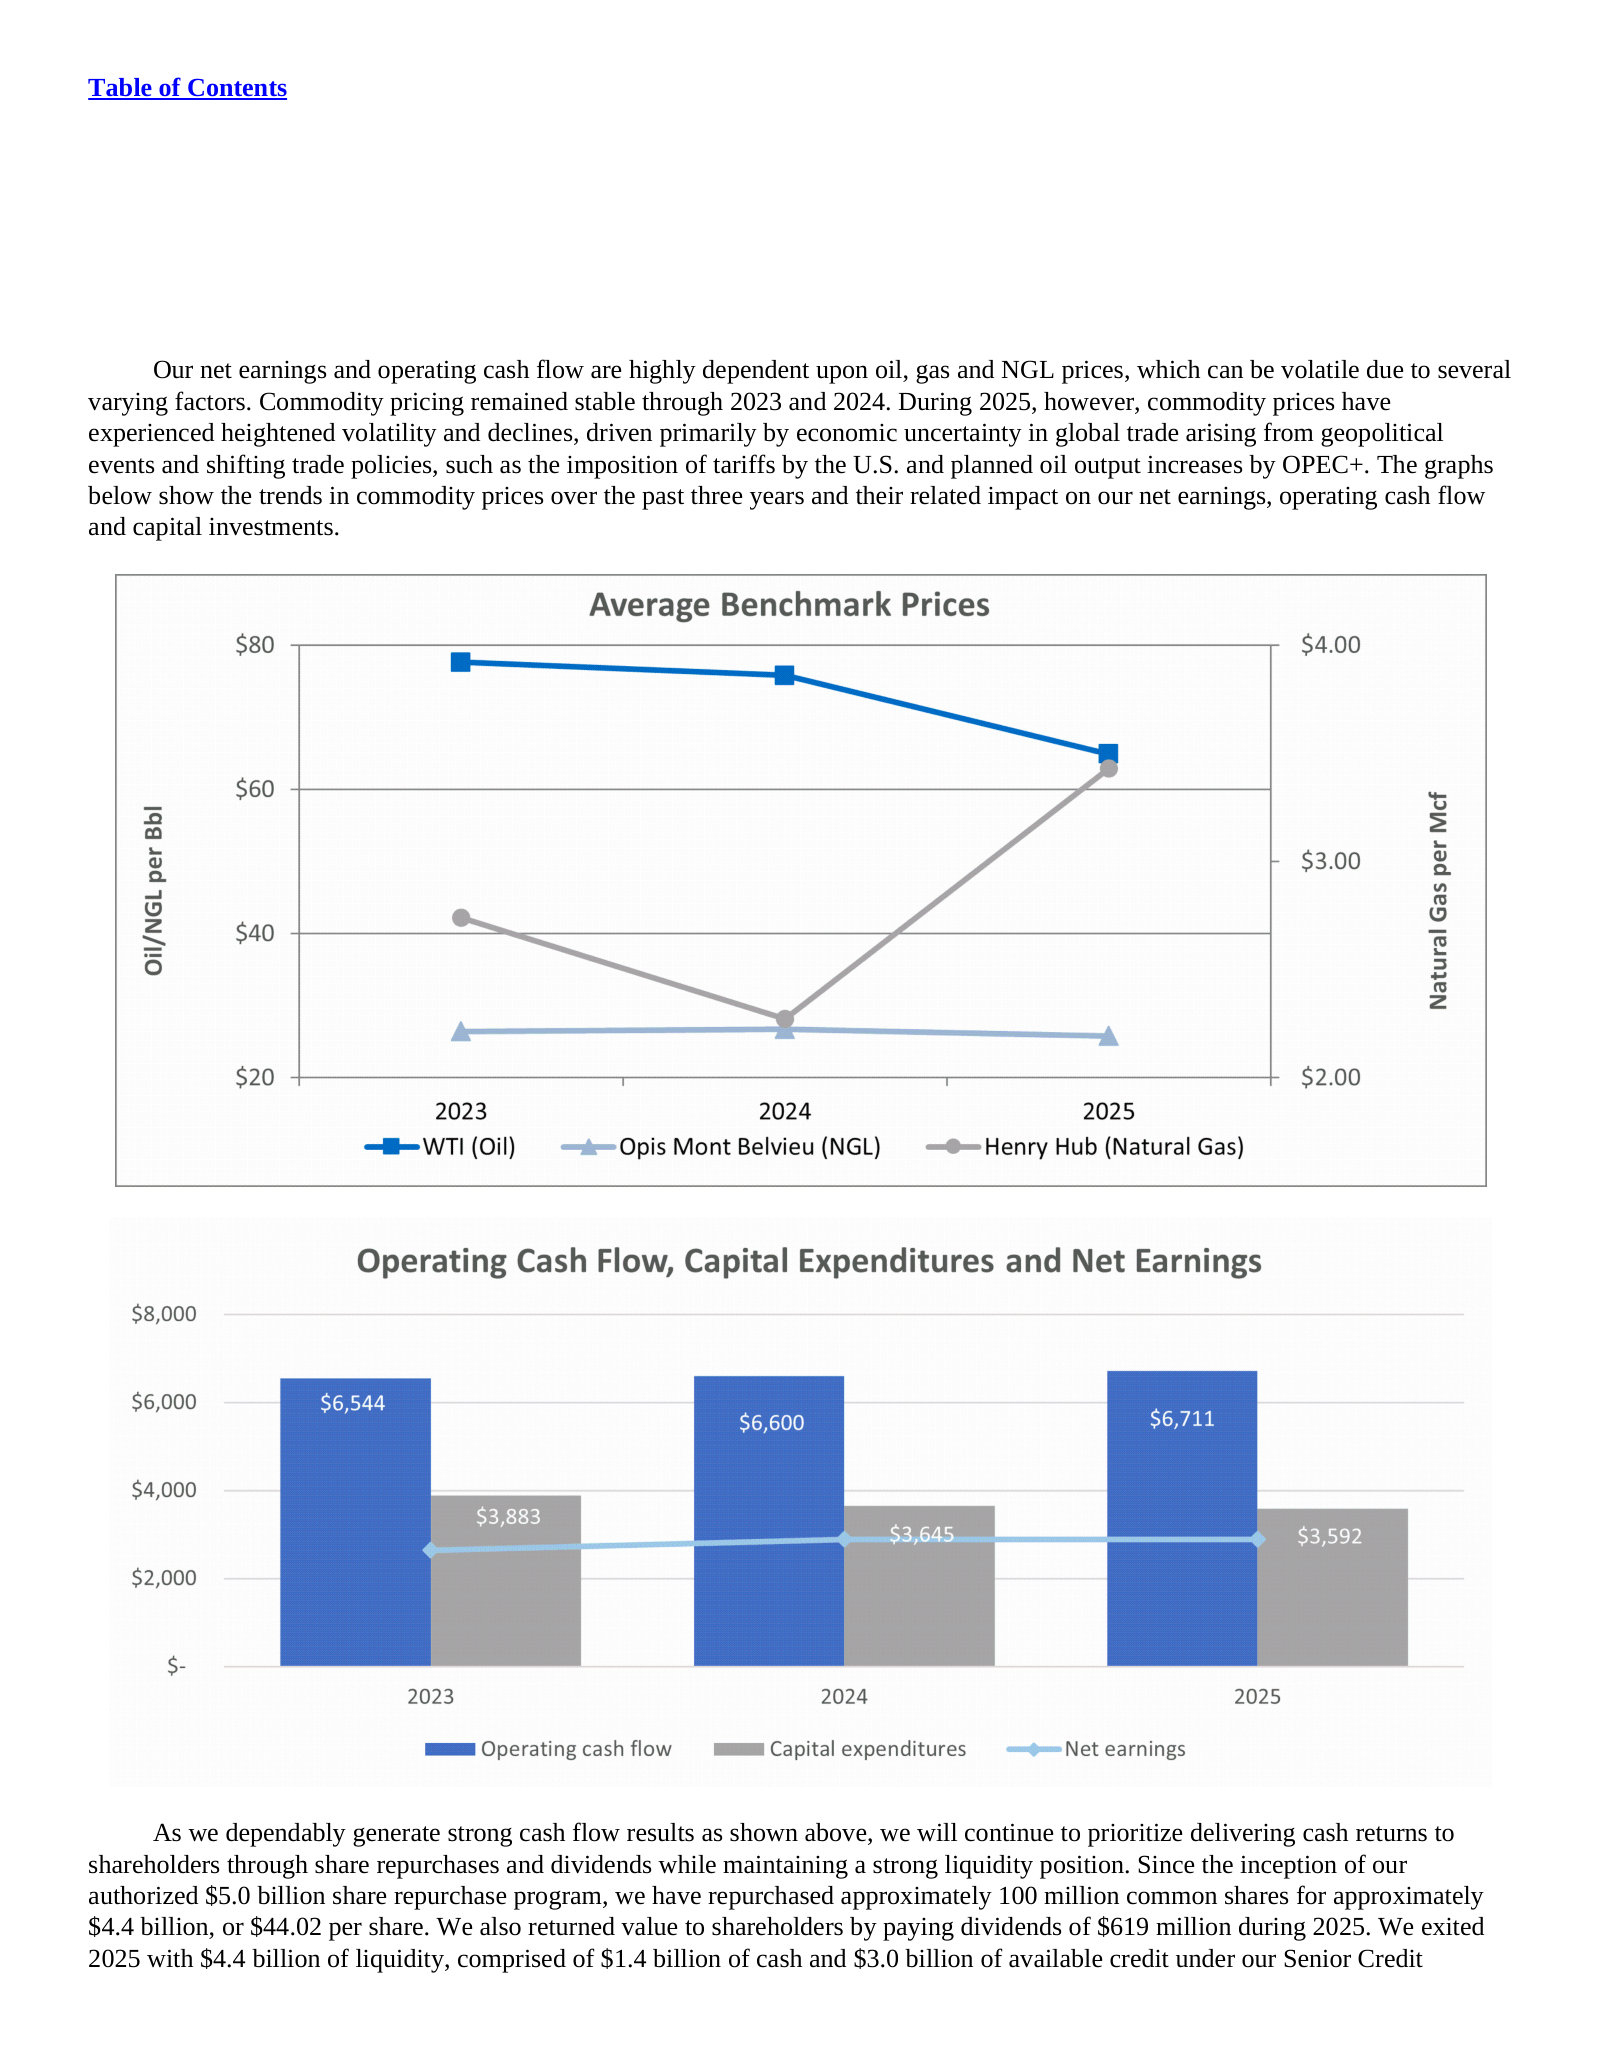
Results of Operations — p. 59 · Read the full section →
The clearest statement of what actually moved 2025: volumes up on Grayson Mill, prices down on WTI, DD&A up on both.
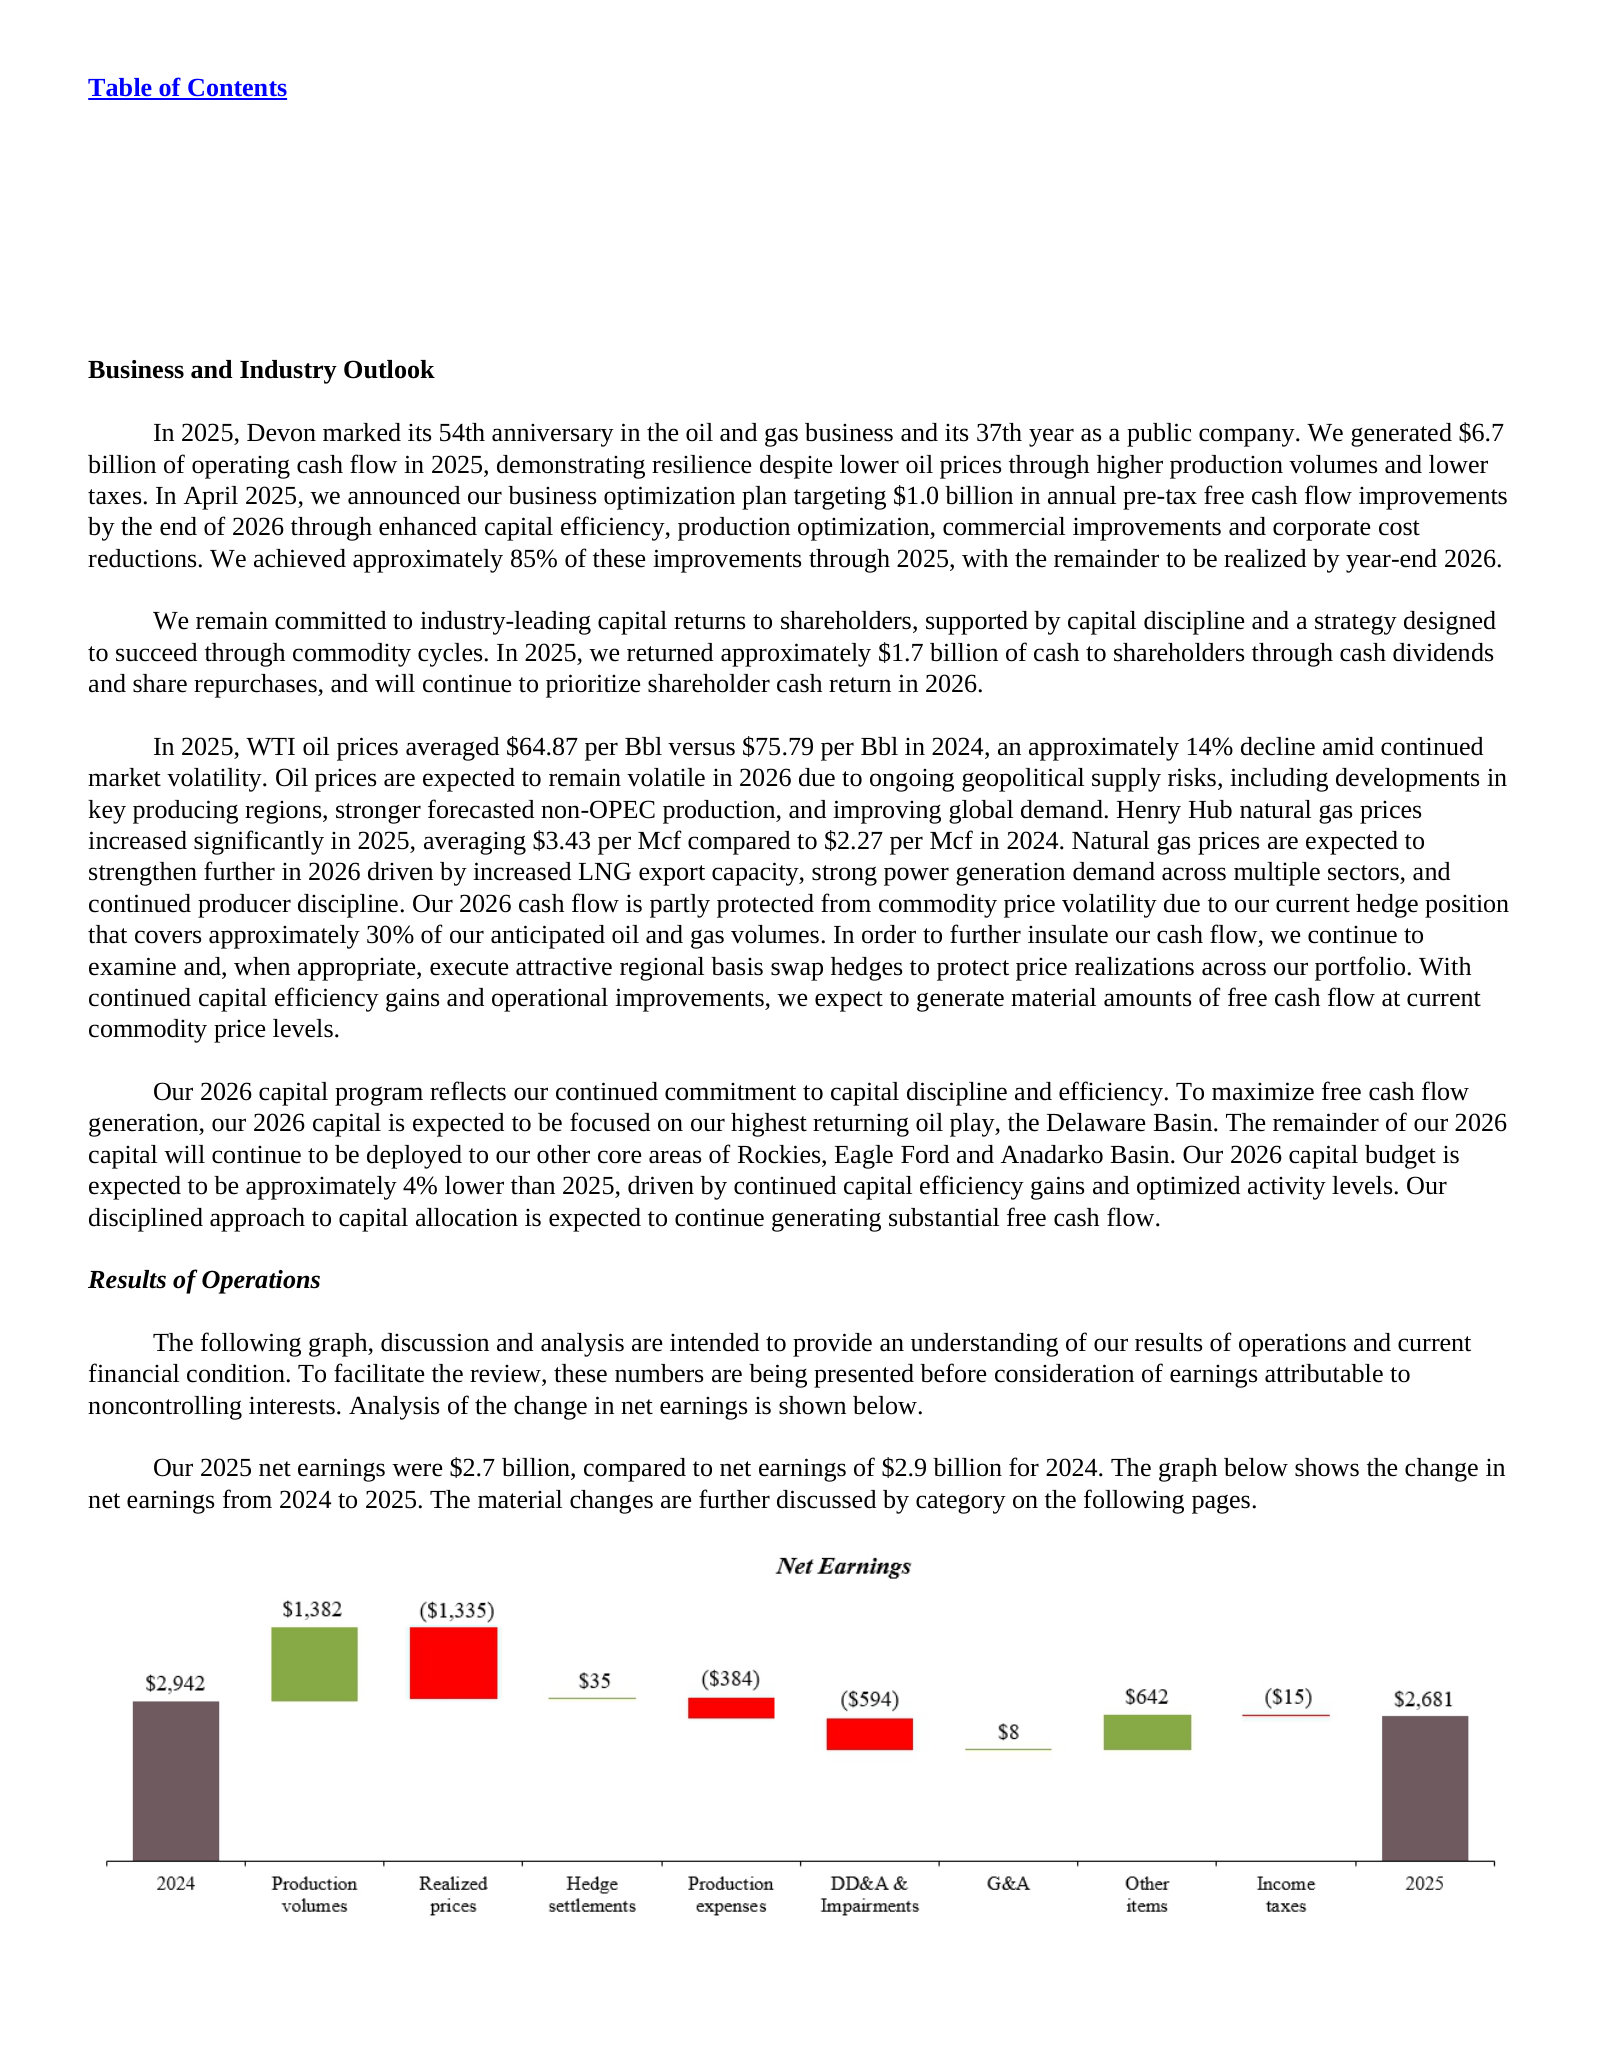
Why realized prices cost $1.3bn: lower WTI and Mont Belvieu, partly offset by higher Henry Hub and hedge settlements.
From 2024 to 2025, realized prices contributed to an approximately $1.3 billion decrease in earnings. This decrease was due to lower unhedged realized oil and NGL prices which decreased primarily due to lower WTI and Mont Belvieu index prices, respectively. This decrease was partially offset by an increase in unhedged realized gas prices which was primarily due to higher Henry Hub index prices. Realized prices were also positively impacted by oil, gas and NGL hedge cash settlements.
p. 63 · Read in context →
Field-Level Cash Margin — p. 65 · Read the full section →
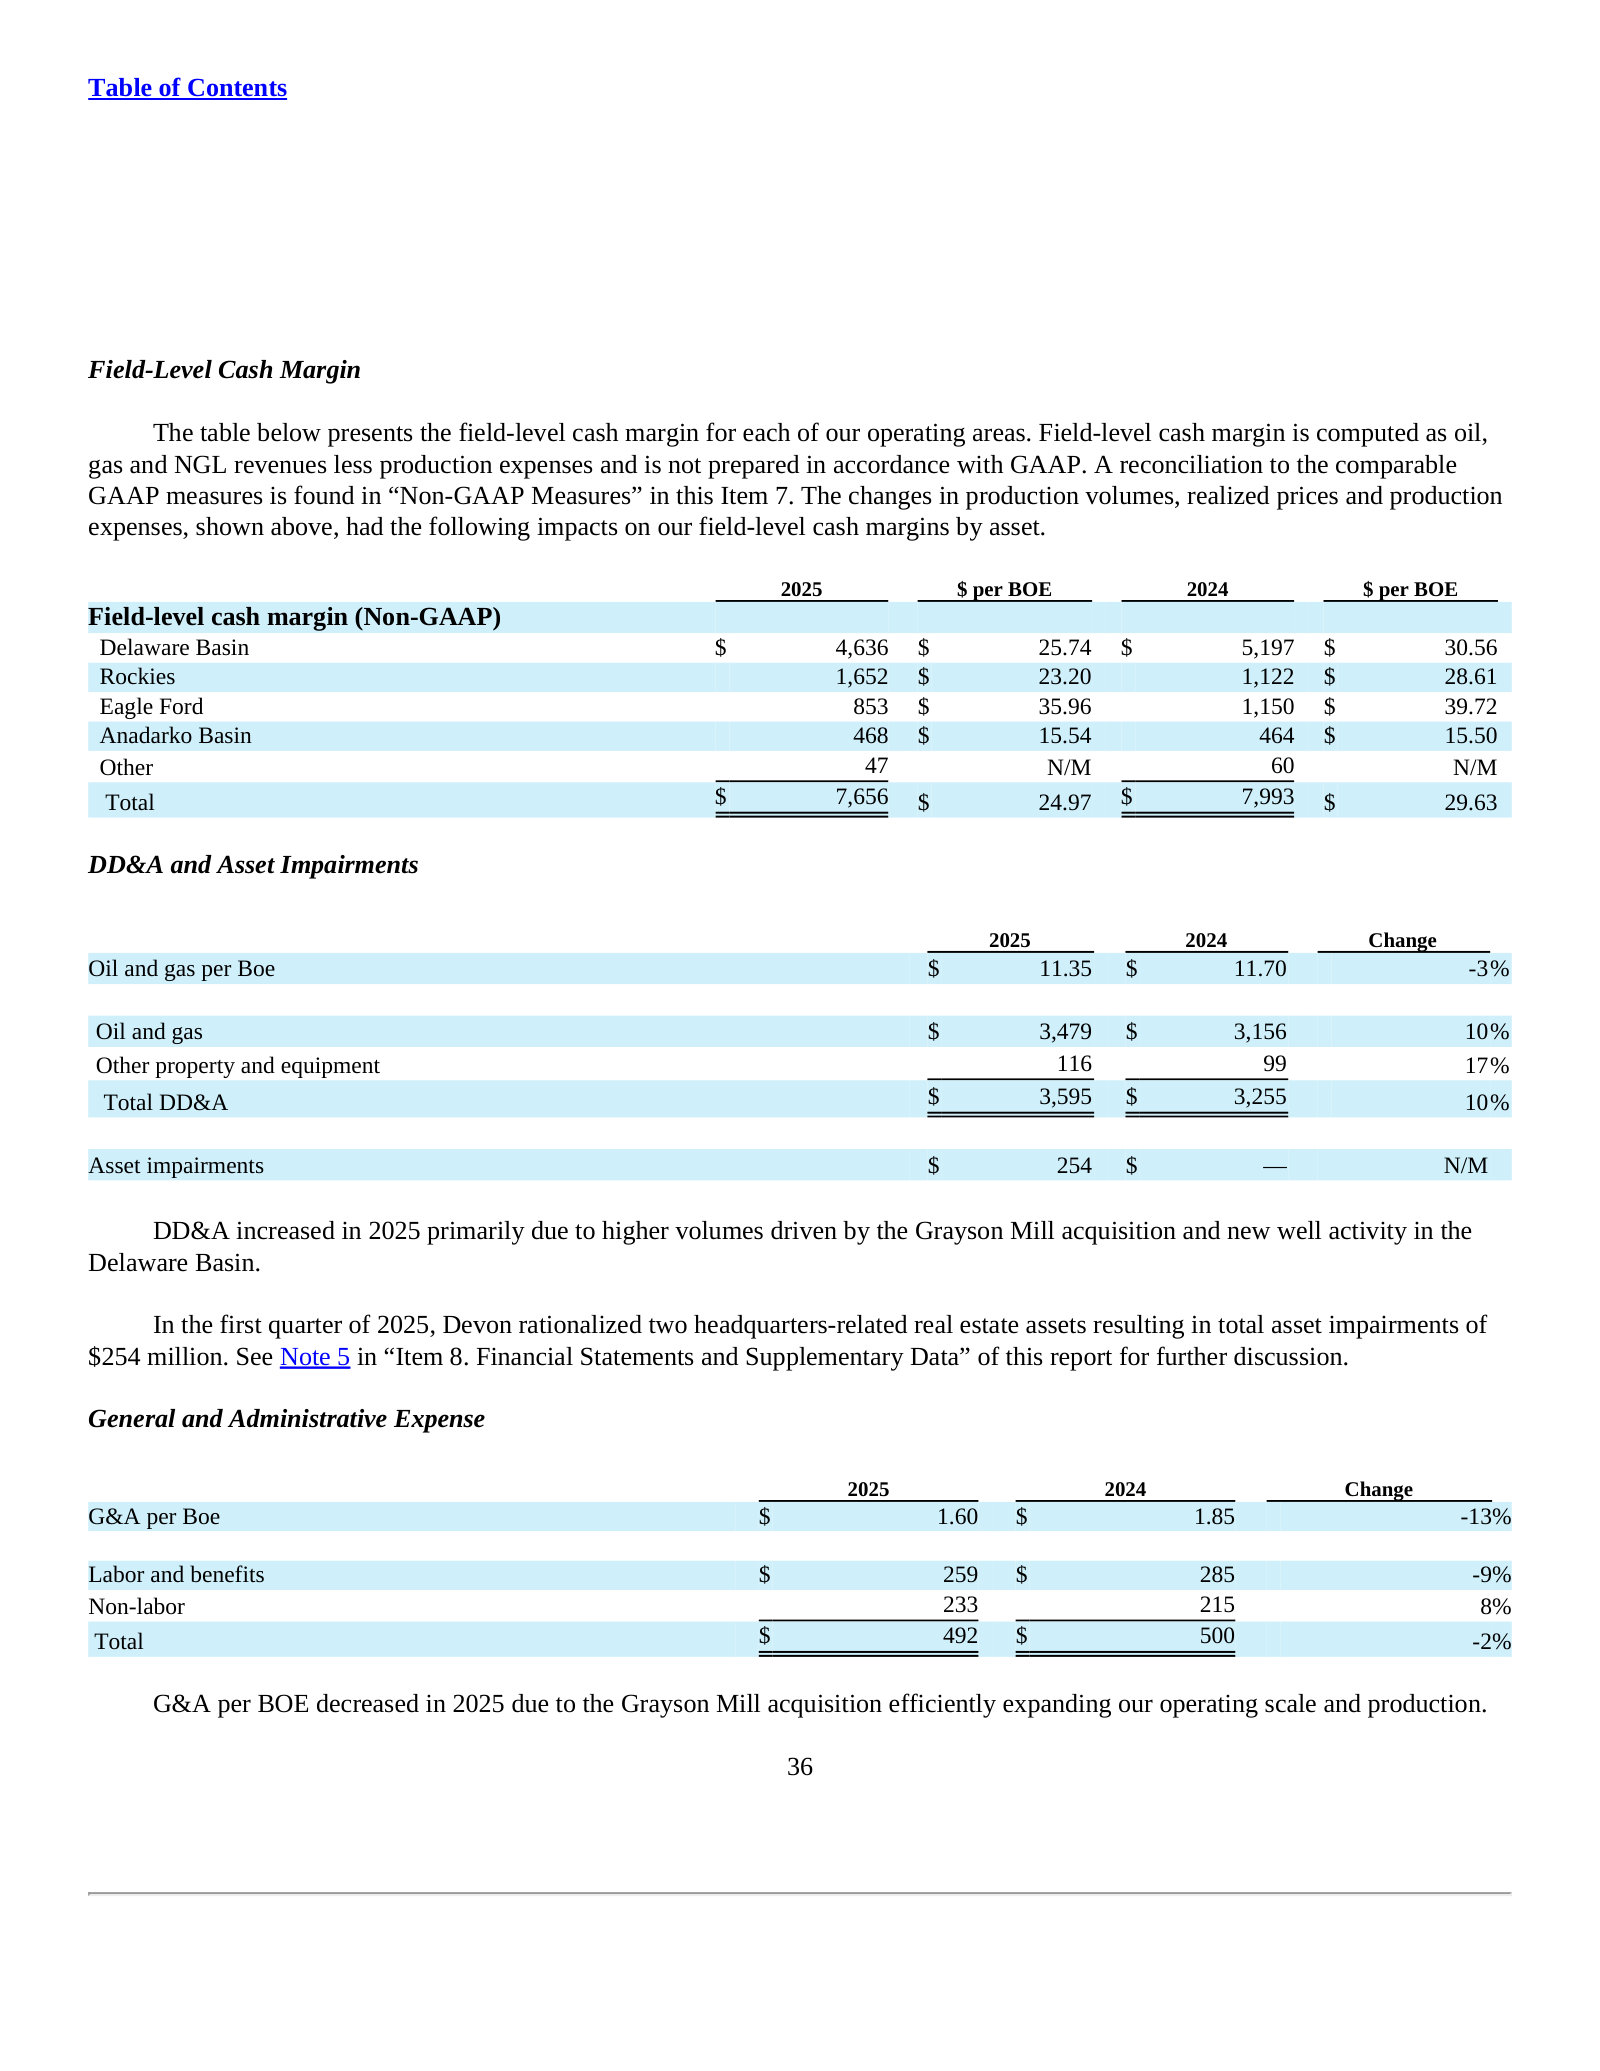
Devon reports one segment, so this table is the only place the four operating areas are compared on unit economics.
Critical Accounting Estimates — p. 75 · Read the full section →
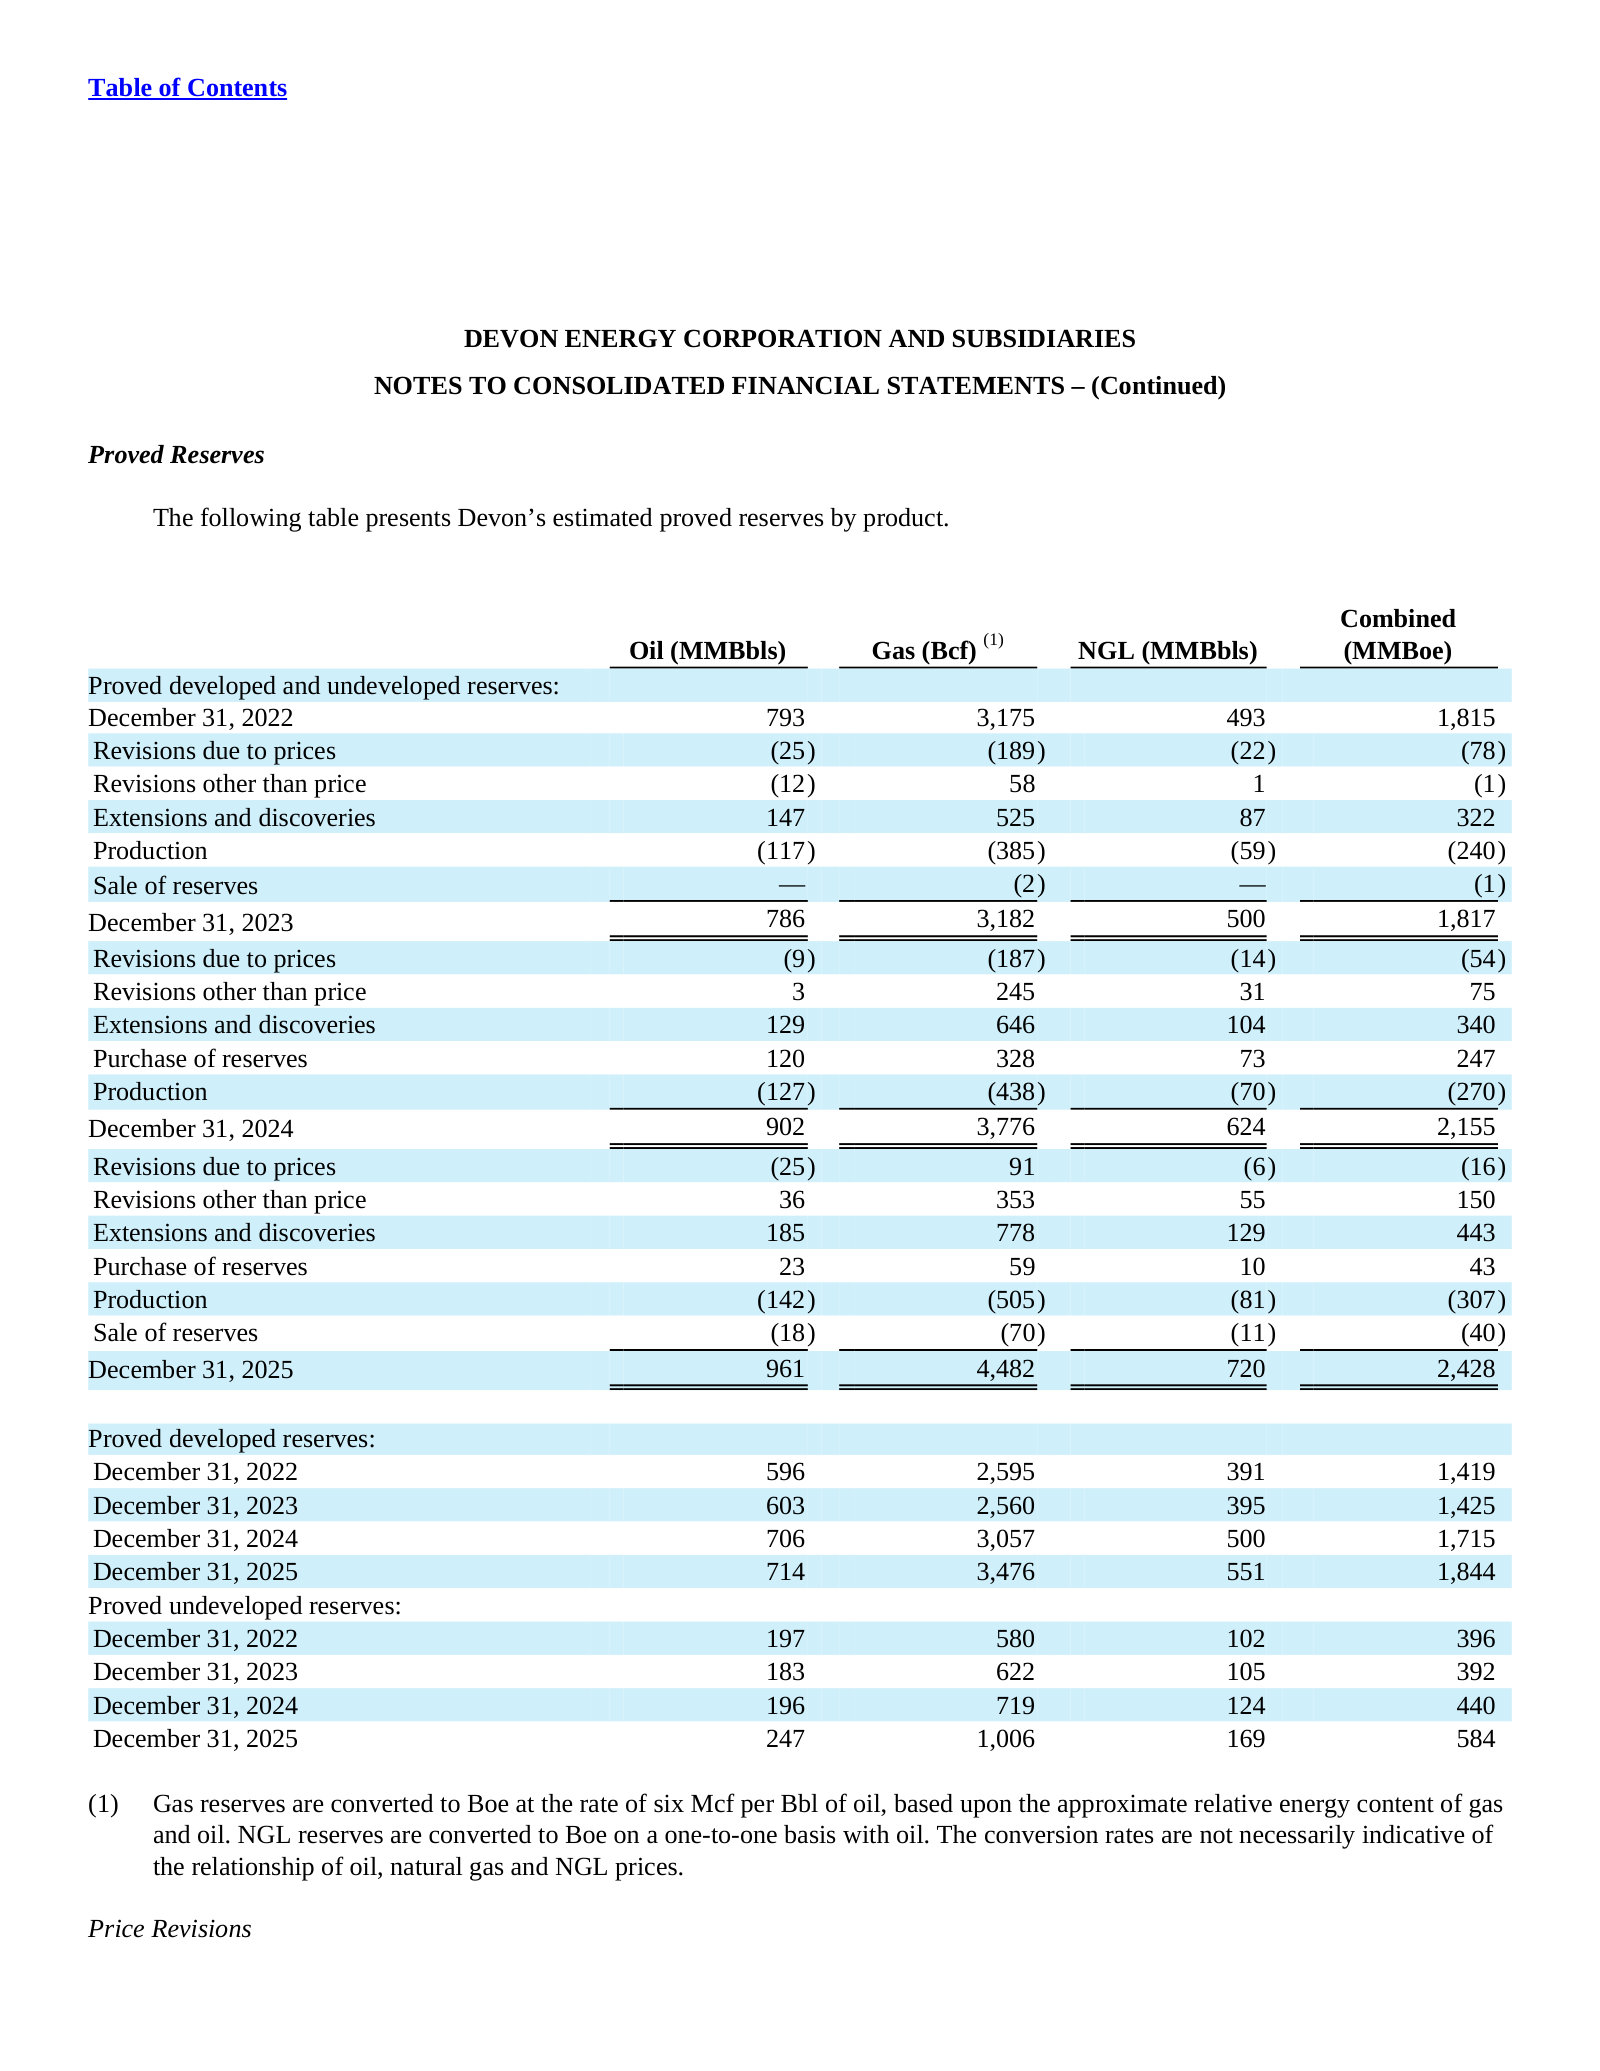
Successful-efforts accounting plus the reserve estimate set what gets capitalized and how fast it is depreciated.
Devon Energy Corporation — FY2021 Annual Report (Form 10-K) — FY2021
Included for contrast only: the WPX merger year, when Devon set out the fixed-plus-variable dividend that FY2025 no longer runs. · Open the full document →
Items 1 and 2. Business and Properties — p. 8 · Read the full section →
The previous merger of equals, and a strategy stated in four principles across five plays rather than five principles across four.
January 2021: the WPX all-stock merger of equals and the cash-return business model it was meant to accelerate.
On January 7, 2021, Devon and WPX completed an all-stock merger of equals. WPX was an oil and gas exploration and production company with assets in the Delaware Basin in Texas and New Mexico and the Williston Basin in North Dakota. This merger enhanced the scale of our operations, built a leading position in the Delaware Basin and accelerated our cash-return business model that prioritizes free cash flow generation and the return of capital to shareholders. […] While our cash flow is highly dependent on volatile and uncertain commodity prices, we pursue our strategy throughout all commodity price cycles with four fundamental principles. […] As a result of our recent Merger and acquisition and divestiture activity, our oil production, price realizations and field-level margins have continued to improve as we continue to sharpen our focus on five U.S. oil and liquids plays located in the Delaware Basin, Anadarko Basin, Williston Basin, Eagle Ford and Powder River Basin.
p. 8 · Read in context →
Item 5. Market for Common Equity, Related Stockholder Matters and Issuer Purchases of Equity Securities — p. 35 · Read the full section →
The fixed-plus-variable dividend as originally defined; FY2025 p.52 drops the variable half and leans on buybacks instead.
Payout mechanics as written in 2021: ~10% of operating cash flow fixed, plus up to 50% of excess free cash flow variable.
Following the closing of the Merger, Devon initiated a “fixed plus variable” dividend strategy. Under this strategy, Devon plans to pay, on a quarterly basis, a fixed dividend amount and, potentially, a variable dividend amount, if any, to its stockholders. […] In determining the amount of the quarterly fixed dividend, the Board expects to consider a number of factors, including Devon’s financial condition, the commodity price environment and a general target of paying out approximately 10% of operating cash flow through the fixed dividend. Any variable dividend amount will be determined on a quarterly basis and will equal up to 50% of “excess free cash flow,” which is a non-GAAP measure and is computed as operating cash flow (a GAAP measure) before balance sheet changes, less capital expenditures and the fixed dividend.
p. 35 · Read in context →
More annual reports
Devon Energy Corporation — FY2024 Annual Report (Form 10-K) — FY2024 · 175 pages · The Grayson Mill year: purchase accounting for the $5.0bn Williston acquisition, and the last edition to report variable dividends paid. · Open →
Devon Energy Corporation — FY2023 Annual Report (Form 10-K) — FY2023 · 174 pages · The pre-acquisition baseline: 658 MBoe/d and $3.8bn of net earnings, with the Anadarko still a significant field and no Williston. · Open →
Devon Energy Corporation — FY2022 Annual Report (Form 10-K) — FY2022 · 135 pages · Peak of the cycle and of the payout: $3.4bn of dividends, $2.9bn of it variable — what the old model returned at $94 WTI. · Open →
Source: S&P Capital IQ consensus via Xpressfeed · Generated 2026-07-30.
Estimate momentum
Currency: USD · Scale: money in millions, absolute · Point-in-time consensus; Δ90d is Now versus 90d.
| Metric | FY | 180d | 90d | 30d | Now | Δ90d |
|---|---|---|---|---|---|---|
| Revenue | FY2027 | $15.78bn | $23.95bn | $28.91bn | $26.62bn | +11.1% |
| Revenue | FY2028 | $19.22bn | $23.29bn | $28.02bn | $26.17bn | +12.4% |
| EPS (normalized) | FY2027 | $4.71 | $5.37 | $5.48 | $5.24 | -2.4% |
| EPS (normalized) | FY2028 | $5.46 | $5.34 | $5.86 | $5.73 | +7.4% |
The step-change lands in Q2 FY26: $6.2bn of consensus revenue against $3.8bn reported in Q1
Reported Q1 FY26 revenue was $3,807m on EBITDA of $1,907m; the Q2 FY26 consensus carries $6,189m of revenue and $3,378m of EBITDA. FY26 EBITDA of $12.5bn against $7,413m actual in FY25 embeds the same discontinuity. The feed supplies no driver for it, but the FY27 revenue momentum series moving from $15.8bn in late January to $26.6bn now shows when the tape absorbed it.
Revenue beat consensus seven quarters running, then missed 3% — while EPS missed four of eight
Revenue surprises ran +7%, +14% and +15% across the three quarters before the latest print, then turned to -3%. Normalized EPS over the same eight quarters splits four beats and four misses, with the two most recent both short. The pattern reads less like sandbagged guidance than like revenue upside that does not reach the EPS line.
Current sequences by metric: Revenue: 1 consecutive miss; EPS (normalized): 2 consecutive misses.
Currency: USD · Scale: money in millions, absolute · Consensus is captured before each actual first became effective.
| Quarter | Metric | Consensus | Actual | Surprise | Outcome |
|---|---|---|---|---|---|
| Q1 FY2026 | Revenue | $3.93bn | $3.81bn | -3.0% | Miss |
| Q1 FY2026 | EPS (normalized) | $1.09 | $1.04 | -4.2% | Miss |
| Q4 FY2025 | Revenue | $3.58bn | $4.12bn | +15.1% | Beat |
| Q4 FY2025 | EPS (normalized) | $0.83 | $0.82 | -0.8% | Miss |
| Q3 FY2025 | Revenue | $3.80bn | $4.33bn | +14.1% | Beat |
| Q3 FY2025 | EPS (normalized) | $0.94 | $1.04 | +10.6% | Beat |
| Q2 FY2025 | Revenue | $4.00bn | $4.28bn | +7.2% | Beat |
| Q2 FY2025 | EPS (normalized) | $0.86 | $0.84 | -2.8% | Miss |
| Q1 FY2025 | Revenue | $4.38bn | $4.45bn | +1.7% | Beat |
| Q1 FY2025 | EPS (normalized) | $1.23 | $1.21 | -1.5% | Miss |
| Q4 FY2024 | Revenue | $4.25bn | $4.40bn | +3.7% | Beat |
| Q4 FY2024 | EPS (normalized) | $1.00 | $1.16 | +15.7% | Beat |
| Q3 FY2024 | Revenue | $3.55bn | $4.02bn | +13.3% | Beat |
| Q3 FY2024 | EPS (normalized) | $1.10 | $1.10 | +0.4% | Beat |
| Q2 FY2024 | Revenue | $3.89bn | $3.92bn | +0.6% | Beat |
| Q2 FY2024 | EPS (normalized) | $1.27 | $1.41 | +11.2% | Beat |
EBITDA jumps nearly 70% in FY26 and 18% in FY27, then flattens at 2% in FY28
Free cash flow more than doubles to $6.3bn in FY26 and reaches $7.5bn by FY28, while net debt is modelled down from $9.0bn to $1.7bn over the same span. Revenue is the odd line out: the FY28 mean sits slightly below FY27, though on five estimates against eight.
Currency: USD · Scale: money in millions, absolute · YoY uses the prior fiscal year from the feed; analyst count and range use the first displayed period.
| Metric | FY2025A | FY2026E | FY2027E | FY2028E | YoY | Analysts | Low / high |
|---|---|---|---|---|---|---|---|
| Revenue | $16.71bn | $23.82bn | $26.62bn | $26.17bn | — | 7 | $15.69bn / $17.23bn |
| EBITDA | $7.40bn | $12.55bn | $14.83bn | $15.10bn | — | 19 | $7.15bn / $7.61bn |
| EPS (normalized) | $3.95 | $4.90 | $5.24 | $5.73 | — | 20 | $3.85 / $4.20 |
| Free cash flow | $2.90bn | $6.28bn | $7.42bn | $7.49bn | — | — | — |
| Net debt | $6.98bn | $9.01bn | $5.59bn | $1.70bn | — | — | — |
21 analysts put FY26 EPS between $3.25 and $5.99 — a spread wider than half the $4.90 mean
For contrast, FY25 normalized EPS — a closed year — spans $3.85 to $4.20 on 20 analysts, so this width is new rather than habitual. EBITDA is the better-triangulated line at $11.2bn to $14.2bn on 17 estimates, while FY26 revenue carries only seven estimates across a $19.6bn–$27.6bn band.
Currency: USD · Scale: money in millions, absolute · Spread/mean is absolute high-low divided by absolute mean.
| Metric | Period | Mean | Low–high | Spread/mean | Analysts |
|---|---|---|---|---|---|
| EPS (normalized) | FY2026E | $4.90 | $3.25–$5.99 | 55.9% | 21 |
| EBITDA | FY2026E | $12.55bn | $11.21bn–$14.21bn | 23.9% | 17 |
| Revenue | FY2026E | $23.82bn | $19.63bn–$27.58bn | 33.3% | 7 |
| EPS (normalized) | FY2027E | $5.24 | $3.82–$6.87 | 58.2% | 22 |
Only seven analysts carry FY26 revenue, and FY29 rests on one to two estimates
The FY26 revenue consensus of $23.8bn rests on seven estimates against 21 for EPS and 17 for EBITDA, so the top line is the least-triangulated number on this page. FY28 revenue thins to five estimates and FY29 carries one revenue and two EBITDA estimates, which is why FY29 is left off the table above. Driver-level broker models sit on the Visible Alpha tab.
Visible Alpha broker models via S&P Xpressfeed · 23 brokers · 571 line items · freshest revision 2026-07-29.
Devon's model set is no longer a standalone forecast: brokers fold a large transaction into 2QFY-2026, roughly doubling modeled oil-equivalent output by FY-2027 and sharply raising the diluted share count. What does not double is per-share cash flow — discretionary cash flow per share is close to flat between FY-2026 and FY-2027 — so the accretion case rests on unit costs and gas realizations rather than on scale itself. Gas carries the added volume, the added revenue and most of the disagreement. Coverage is deep and fresh on the headline lines, and thin on almost everything that describes the deal.
Models now carry a company twice the size — and a share count to match
Oil-equivalent output rises by roughly two-thirds in FY-2026 and by a fifth again in FY-2027, but discretionary cash flow per share barely moves between those two years. Free cash flow per share is the better-behaved accretion line; the volume lines are close to settled, with narrow quartile bands.
| Line | FY-2025A | FY-2026E | FY-2027E | FY-2028E | YoY | Brokers |
|---|---|---|---|---|---|---|
| Volumes | — | — | — | — | — | — |
| Total oil equivalent production per day(Mboe) | 837,910 boe | 1.38m boe | 1.69m boe | 1.71m boe | +64.8% | 22 |
| Total oil production per day(Mbpd) | 388,071 bpd | 497,532 bpd | 559,101 bpd | 562,474 bpd | +28.2% | 22 |
| Total NGLs production per day(Mbpd) | 219,676 bpd | 323,409 bpd | 387,814 bpd | 395,934 bpd | +47.2% | 22 |
| Total natural gas production per day(Mmcf) | 1.38m mcf | 3.36m mcf | 4.49m mcf | 4.54m mcf | +142.9% | 22 |
| Scale | — | — | — | — | — | — |
| Revenue - Oil, NGLs & NG | $11.23bn | $18.78bn | $21.68bn | $22.22bn | +67.2% | 23 |
| EBITDA | $7.38bn | $11.87bn | $14.61bn | $15.01bn | +60.8% | 20 |
| Per share | — | — | — | — | — | — |
| Shares - Diluted(M#) | 633.31m Number | 969.47m Number | 1.11bn Number | 1.06bn Number | +53.1% | 23 |
| Discretionary cash flow per share($) | $10.28 | $11.74 | $11.87 | $12.87 | +14.2% | 19 |
| Free cash flow (FCF) per share($) | $4.79 | $5.85 | $6.93 | $7.83 | +22.2% | 16 |
Gas carries the growth: oil revenue is flat after FY-2026 while gas revenue doubles
The lift is not the strip — brokers carry Henry Hub flat to slightly lower in FY-2027 — but the corporate realization, with gas ex-hedging moving from $1.65 to $2.57. That is a mix effect. Oil realizations fall with the deck over the same span, so oil revenue holds flat on materially higher volumes.
| Line | FY-2025A | FY-2026E | FY-2027E | FY-2028E | YoY | Brokers |
|---|---|---|---|---|---|---|
| Revenue | — | — | — | — | — | — |
| Revenue - Natural gas - excl. hedging | $859.30m | $2.02bn | $4.20bn | $4.67bn | +134.6% | 20 |
| Revenue - Oil - excl. hedging | $8.99bn | $14.21bn | $14.33bn | $14.25bn | +58.1% | 21 |
| Revenue - NGLs - excl. hedging | $1.42bn | $2.38bn | $2.82bn | $2.86bn | +68.3% | 21 |
| Realized price | — | — | — | — | — | — |
| Total Natural Gas price ex. hedging($) | $1.70 | $1.65 | $2.57 | $2.80 | -3.1% | 22 |
| Total oil price excl. hedging($) | $62.80 | $77.87 | $70.44 | $70.04 | +24.0% | 22 |
| Total NGLs price ex. hedging($) | $18.32 | $20.09 | $19.70 | $19.72 | +9.6% | 22 |
| Price deck | — | — | — | — | — | — |
| Henry Hub : Natural gas price($) | $3.43 | $3.69 | $3.58 | $3.80 | +7.5% | 22 |
| WTI : Oil price($) | $64.85 | $78.92 | $71.71 | $71.29 | +21.7% | 22 |
The step-change lands in 2QFY-2026; 3QFY-2026 is the first clean run-rate
2QFY-2026 blends part-period contribution and carries an unusually low modeled gas realization on 11 brokers, so it reads poorly as a run-rate; take 3QFY-2026 onward instead. The new Marcellus gas line is where the added volume sits, and only three to five brokers carry it.
| Line | 3QFY-2025A | 4QFY-2025A | 1QFY-2026A | 2QFY-2026A | 3QFY-2026E | 4QFY-2026E | 1QFY-2027E | 2QFY-2027E | Brokers |
|---|---|---|---|---|---|---|---|---|---|
| Total oil equivalent production per day(Mboe) | 842,156 boe | 842,725 boe | 837,400 boe | 1.32m boe | 1.67m boe | 1.69m boe | 1.69m boe | 1.70m boe | 20 |
| Total natural gas production per day(Mmcf) | 1.39m mcf | 1.38m mcf | 1.38m mcf | 3.10m mcf | 4.38m mcf | 4.43m mcf | 4.46m mcf | 4.48m mcf | 20 |
| Natural gas production per day - Marcellus(Mmcf) | — | — | — | 1.24m mcf | 1.96m mcf | 2.00m mcf | 2.01m mcf | 2.09m mcf | 5 |
| Shares - Diluted(M#) | 631.93m Number | 625.08m Number | 621.39m Number | 930.58m Number | 1.14bn Number | 1.14bn Number | 1.13bn Number | 1.12bn Number | 21 |
| Total Natural Gas price ex. hedging($) | $1.46 | $1.47 | $1.72 | $0.53 | $1.90 | $2.44 | $2.98 | $2.15 | 20 |
| Production cost per unit($) | $11.74 | $11.33 | $11.85 | $11.27 | $10.44 | $10.40 | $10.38 | $10.15 | 21 |
| Free Cash Flow | $730.33m | $610.60m | $827.58m | $1.35bn | $1.71bn | $1.79bn | $1.93bn | $1.68bn | 15 |
The argument is over the gas netback and what the balance sheet does with it
Volumes are close to agreed, so the value debate has moved to price realization and capital allocation. The buyback line rests on ten brokers and its range is more than three times wide, which is the single largest swing factor in the per-share case.
| Line | Period | Median | Q1–Q3 | Min–max | Brokers |
|---|---|---|---|---|---|
| Total Natural Gas price ex. hedging($) | FY-2027E | $2.59 | $2.44–$2.81 | $2.02–$2.92 | 17 |
| Operating income/(loss) - Oil, NGLs & NG | FY-2027E | $8.46bn | $7.36bn–$9.07bn | $5.95bn–$10.06bn | 13 |
| Net debt | FY-2027E | $4.48bn | $2.78bn–$6.67bn | $-2.80bn–$8.68bn | 16 |
| Repurchases of common stock | FY-2027E | $2.31bn | $2.00bn–$2.80bn | $1.39bn–$5.03bn | 10 |
Unit costs bend the right way: production cost per unit falls from $11.72 to $10.28
Every per-unit line brokers carry moves lower through FY-2027 — lease operating, production taxes, G&A and DD&A — and the quartile bands are tight, so this is closer to a shared assumption than one house's synergy math. Returns are the exception: the ROACE band stays wide throughout.
| Line | FY-2025A | FY-2026E | FY-2027E | FY-2028E | YoY | Brokers |
|---|---|---|---|---|---|---|
| Cost per unit | — | — | — | — | — | — |
| Production cost per unit($) | $11.72 | $10.88 | $10.28 | $10.28 | -7.2% | 22 |
| Total lease operating expense per Boe($) | $9.04 | $8.25 | $7.84 | $7.78 | -8.7% | 21 |
| Production and property taxes per Boe($) | $2.67 | $2.58 | $2.37 | $2.41 | -3.3% | 21 |
| General and administrative expense per Boe($) | $1.57 | $1.39 | $1.13 | $1.04 | -10.9% | 22 |
| Total DD&A per Boe($) | $11.72 | $11.25 | $10.66 | $10.53 | -4.0% | 22 |
| Returns | — | — | — | — | — | — |
| Return on average capital employed (ROACE)(%) | 12.2% | 14.5% | 14.9% | 14.9% | +2.2pt | 16 |
Deal-specific lines are thin, and the transaction accounting is not settled
The consensus was last updated on 2026-07-29 and the headline lines are deep, but the deal detail is not: Marcellus volumes rest on three to five brokers, and per-basin capex and well counts thin further into FY-2028. The FY-2026 acquisition line spans from roughly break-even to tens of billions of dollars, which reads as a definitional split over what counts as consideration rather than a genuine forecast range. Treat per-basin and reserve detail as indicative only.
Headline P&L consensus, momentum and beat/miss live in the CapIQ tab.
Source: S&P Capital IQ transcripts via Xpressfeed · latest indexed call 2026-05-06 · generated 2026-07-30.
Latest call digest
Devon Energy Corporation, Q1 2026 Earnings Call, May 06, 2026 · 2026-05-06T15:00:00
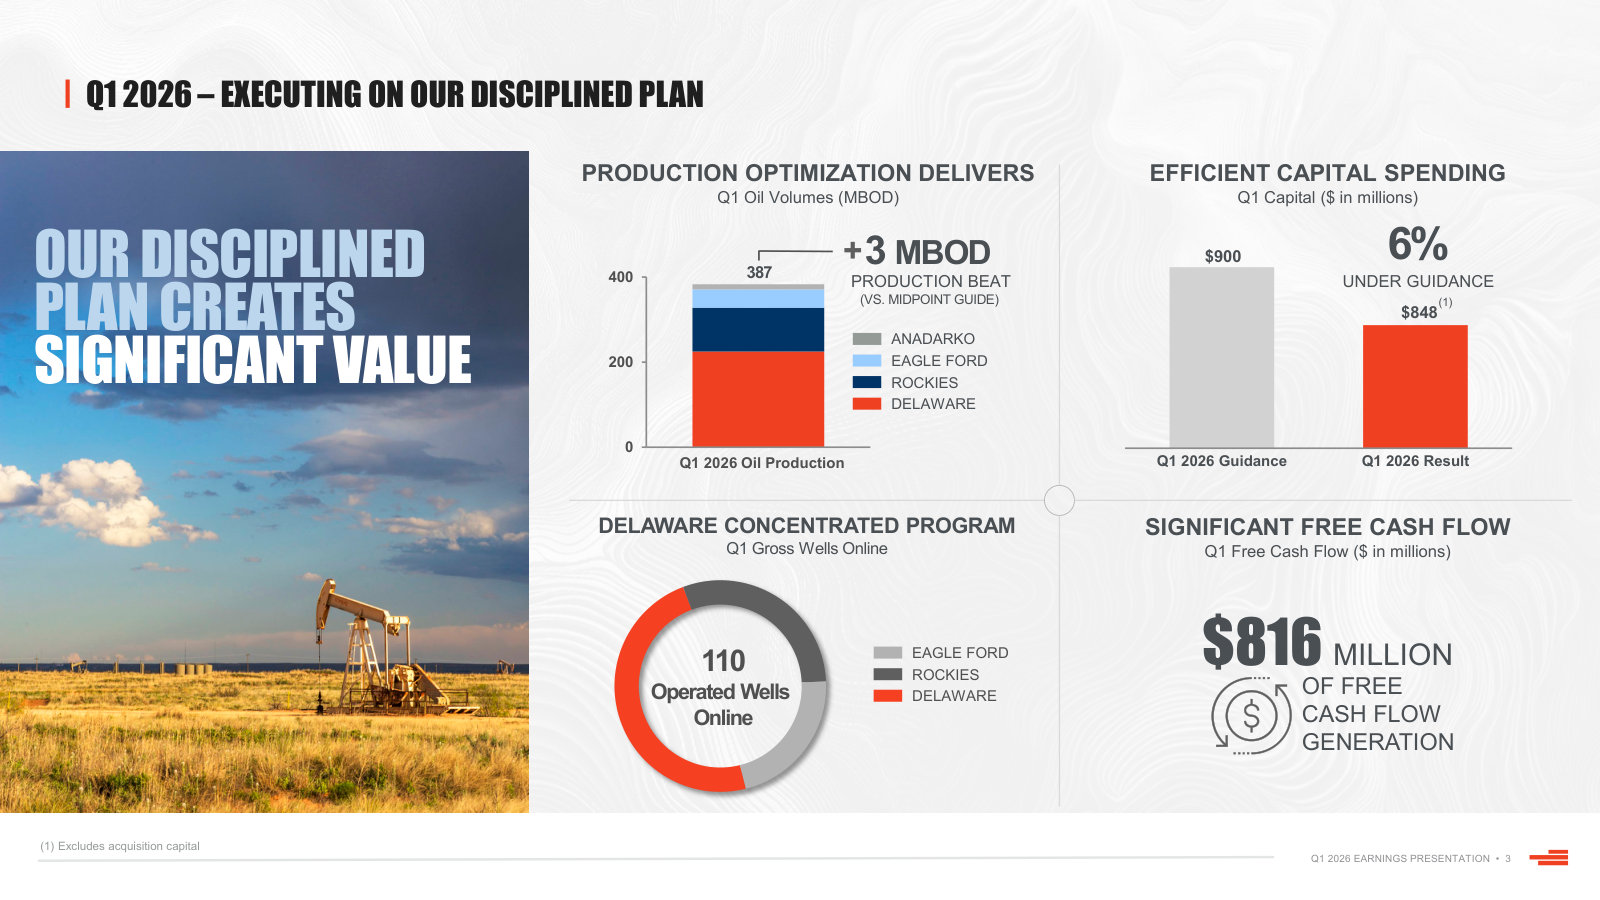
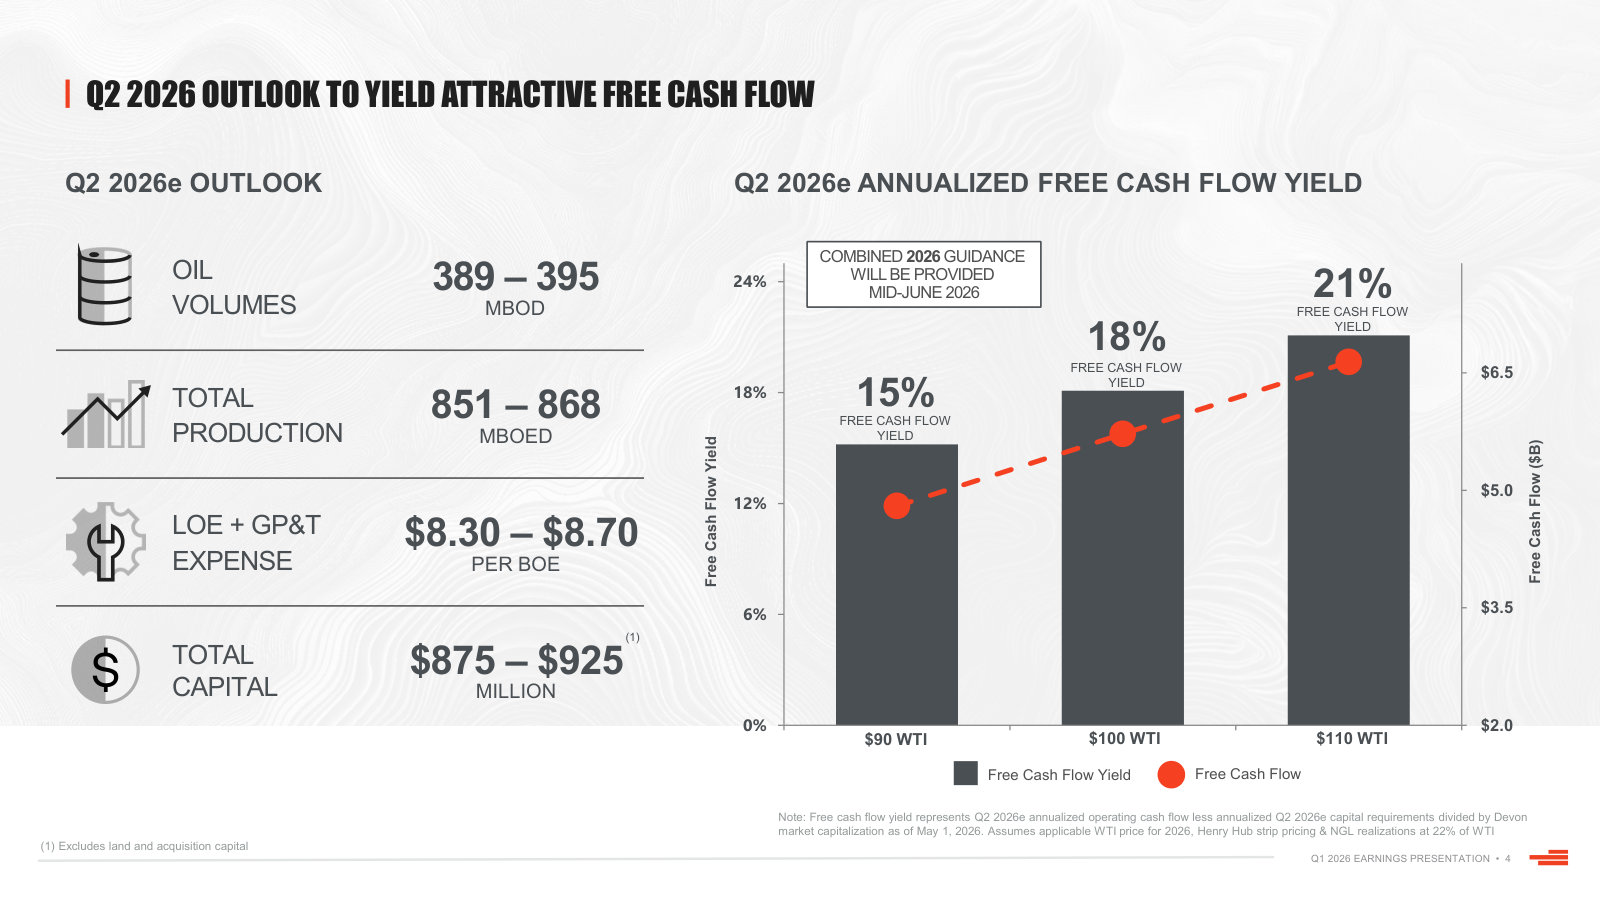
Q1 2026 call, May 6, 2026. Devon reported oil of 387,000 barrels per day at the top end of guidance, capital 6% below the midpoint of guidance, and $816 million of free cash flow. Clay Gaspar said the company will achieve its $1 billion business optimization target ahead of schedule, and devoted the largest single block of prepared remarks to AI, describing three internal waves of adoption and more than 850 wells on fully autonomous artificial lift optimization.
The call was really about the Coterra merger. Shareholders of both companies approved it on May 4 and management expected to close the following day. Prepared remarks set out the forward framework: a dividend increase of over 30% per share from the second quarter subject to Board approval, share repurchases resuming immediately post-close after both companies paused them between announcement and close, and $1 billion of run-rate synergies by year-end 2027 that Gaspar called the floor rather than the ceiling, with 156 distinct value capture opportunities already identified.
The Q&A reality was different. Most of the analysts on the line pushed on what the combined company will actually look like, and management declined to pre-commit on nearly all of it. Gaspar would not weight the portfolio review criteria, would not accelerate the synergy timeline, would not comment on the Kimmeridge letter or on whether a gas-weighted mix is a problem, and repeatedly deferred to conversations not yet held with the new combined Board. Combined full-year guidance was pushed to mid-June. The concrete numbers that did come out of Q&A were operational rather than strategic: Waha exposure falling to 10% to 15% once Blackcomb starts up, a full-year stand-alone current tax rate around 10% with higher rates in coming quarters, roughly $150 million of Q1 acquisition capital that was 90% Delaware, and a refusal to quantify the artificial lift production uplift beyond saying it beat the 2% to 3% pilot result.
Participant coverage from the latest call.
| Group | Participants | Count |
|---|---|---|
| Management | Operator; Christopher Carr — Director of Investor Relations, Devon Energy Corporation; Clay Gaspar — President, CEO & Director, Devon Energy Corporation; Jeffrey Ritenour — Executive VP & Chief Corporate Development Officer, Devon Energy Corporation; Robert Lowe — Executive VP & Chief Technology Officer, Devon Energy Corporation; John Raines — Executive Vice President of Exploration & Production – Permian, Devon Energy Corporation | 6 |
| Analysts | Arun Jayaram — Senior Equity Research Analyst, JPMorgan Chase & Co, Research Division; Neal Dingmann — Research Analyst, William Blair & Company L.L.C., Research Division; Neil Mehta — VP and Integrated Oil & Refining Analyst, Goldman Sachs Group, Inc., Research Division; Scott Gruber — Director, Head of Americas Energy Sector & Senior Analyst, Citigroup Inc., Research Division; Joshua Silverstein — Analyst, UBS Investment Bank, Research Division; Phillip Jungwirth — U.S. Energy Analyst, BMO Capital Markets Equity Research; John Freeman — MD & Research Analyst, Raymond James & Associates, Inc., Research Division; Wei Jiang — Research Analyst, Barclays Bank PLC, Research Division; Douglas George Blyth Leggate — MD & Senior Research Analyst, Wolfe Research, LLC; Kevin MacCurdy — Director of Research, Pickering Energy Partners Insights | 10 |
Curated latest-call exchanges; one row per analyst topic.
| Analyst | Firm | Topic | What changed in Q&A |
|---|---|---|---|
| Arun Jayaram | JPMorgan Chase & Co | Portfolio review criteria and use of divestiture proceeds | Opened the call asking what defines a core asset and where proceeds would go. Gaspar listed capital efficiency, inventory depth, free cash flow and overall fit, but said it is not a simple formula and declined to attach a timeline or any preconceptions. |
| Douglas George Blyth Leggate | Wolfe Research | Credibility of the $1 billion synergy target before close | Pressed on how the target could be underwritten without full access to Coterra's books. Gaspar described clean-room data exchange through third parties, then declined to raise the number or pull forward the timeline. |
| Douglas George Blyth Leggate | Wolfe Research | Kimmeridge letter and the gas-versus-oil portfolio mix | Asked directly whether a gas-skewed mix confuses investors. Gaspar declined to discuss any specific investor and reframed the answer around investor views being plural and around every asset earning its seat at the table. |
| Neil Mehta | Goldman Sachs | Pulling forward the year-end 2027 synergy target | Asked for early wins and whether the target date could move. Gaspar pointed to the 156 identified projects and to the tracking mechanics built during business optimization, but gave no acceleration. |
| Neil Mehta | Goldman Sachs | Advantages of a more Delaware-focused portfolio | Gaspar pushed back on the premise that Devon is unfocused today and again declined to signal direction ahead of Board alignment. He noted that applying $1 billion of synergies can change how assets rank against each other. |
| Joshua Silverstein | UBS Investment Bank | Pro forma inventory depth beyond the 10-plus-year third-party estimate | John Raines declined to give a number, citing work still to do, and pointed instead to 2025 Delaware downspacing that replaced almost 100% of consumption as the analogue. |
| Neal Dingmann | William Blair & Company | Negative Waha prices and Permian exposure | The clearest numeric answer of the call. Gaspar described curtailing the gassiest wells; Ritenour said Waha exposure falls to 10% to 15% once Blackcomb comes online later this year. |
| Wei Jiang | Barclays Bank PLC | Buyback catch-up after the pre-close pause and target debt level | Asked whether repurchases would make up for the paused period and what optimal leverage looks like. Gaspar declined to frame it as catch-up and deferred both to the new Board; Ritenour said to expect philosophies consistent with each stand-alone company. |
| Phillip Jungwirth | BMO Capital Markets | Autonomous artificial lift and run-time improvement | Raines gave the 2% to 3% pilot uplift and the 850-well and 1,500-well figures but explicitly declined to quantify the scaled uplift, saying only that it exceeds what the pilot showed. |
| Kevin MacCurdy | Pickering Energy Partners | Macro and what would trigger more than a maintenance program | Gaspar acknowledged the supply and demand dynamic has changed significantly in recent months but said it is too early to call, and reiterated that Devon steers on the back of the curve rather than the front. |
| Scott Gruber | Citigroup | Where incremental cash goes: refracs, EOR, AI | Gaspar said refracs have gone quieter because falling drilling costs now force them to compete with new wells, and that EOR and surfactant work involves relatively small investments. The material cash uses remain dividend, repurchases and debt. |
Theme tracker
Themes are curator-classified across supplied calls.
| Theme | Status | Quarters mentioned | Read-through |
|---|---|---|---|
| Business optimization: the $1 billion free cash flow target | persisted | Q1 2025, Q2 2025, Q3 2025, Q4 2025, Q1 2026 | Launched on the Q1 2025 call and reported on every quarter since: 40% captured after four months, more than 60% by Q3 2025, 85% by Q4 2025, then declared achieved ahead of schedule in Q1 2026. The framing changed alongside the number, from a project with an end date to what management now calls a cultural norm. This is the most consistent disclosure thread in the set and the basis on which management asks to be trusted with the Coterra synergy target. |
| AI and technology as the mechanism behind cost and production gains | persisted | Q1 2025, Q2 2025, Q3 2025, Q4 2025, Q1 2026 | Neither AI nor artificial intelligence appears in the 2023 or 2024 calls in this set; the vocabulary enters with the business optimization program in Q1 2025 and expands every quarter thereafter, from employee productivity tools to in-frac and in-drill agents to smart gas lift. By Q1 2026 it is the longest single passage of prepared remarks. Devon is asking investors to underwrite technology as a durable source of capital efficiency rather than a one-off. |
| Coterra merger, synergies and the portfolio review | emerged | Q4 2025, Q1 2026 | Announced ahead of the Q4 2025 call, where management explicitly asked analysts to keep Q&A on stand-alone results. By Q1 2026 it dominated both prepared remarks and Q&A. The genuinely new element is the open-ended review of every asset in the combined portfolio, which management describes without preconceptions and without a timeline. |
| Permian gas takeaway and Waha exposure | persisted | Q2 2024, Q3 2024, Q2 2025, Q3 2025, Q1 2026 | A recurring question from multiple firms across two years, with the answer evolving from Matterhorn start-up and Katy backup risk, to marketing agreements indexed to ERCOT power prices and international markers, to a stated 10% to 15% residual Waha exposure once Blackcomb starts up. Persistent enough that it functions as a standing check on Delaware margins. |
| Inventory depth and the ten-year runway | persisted | Q2 2024, Q3 2024, Q4 2024, Q4 2025, Q1 2026 | Analysts have tested the ten-year claim in every configuration: Delaware, Williston after Grayson Mill, Anadarko, and now pro forma with Coterra. Management's answer has shifted from defending third-party estimates to arguing that lower well costs convert marginal locations into inventory, which is a different and more contingent claim. |
| Variable dividend | dropped | Q2 2023, Q3 2023, Q4 2023, Q1 2024, Q2 2024, Q3 2024 | A standing feature of the cash return discussion across six consecutive calls, then discontinued on the Q3 2024 call, where Ritenour said the variable would remain a tool but that near-term returns would come through the fixed dividend and share repurchases. It has not been raised by management or by any analyst on the six calls since. The cash return debate moved permanently to buybacks versus debt. |
| Refracs | dropped | Q2 2023, Q3 2023, Q4 2023, Q1 2024, Q2 2024, Q3 2024, Q4 2024 | Discussed on every call from Q2 2023 through Q4 2024, where management called itself very pro refrac with a large inventory of candidates. Absent from Q2 2025 through Q4 2025. On the Q1 2026 call Gaspar named the absence himself and gave the reason: drilling costs have fallen far enough that refracs now compete against new wells. The drop reflects a changed economic ranking rather than a failed program. |
| The specific $2.5 billion debt reduction target | dropped | Q1 2024, Q2 2024, Q3 2024, Q4 2024, Q2 2025, Q3 2025 | Introduced with the Grayson Mill financing and tracked by number for six calls, reaching nearly $1 billion retired as of Q3 2025. The figure does not appear on the Q4 2025 or Q1 2026 calls. Debt repayment remains one of the three named uses of cash post-merger, but the absolute target has not been restated for the combined company. |
Guidance ledger
Quotes, calls, and speakers are source-verified; outcomes are curator-classified.
| Verbatim guidance | Call | Speaker | Curator outcome | Outcome note |
|---|---|---|---|---|
| “Subject to formal Board approval, our dividend will increase by over 30% on a per share basis starting in the second quarter.” | Devon Energy Corporation, Q1 2026 Earnings Call, May 06, 2026 · 2026-05-06T15:00:00 | Clay Gaspar | pending | Consistent with the 31% increase flagged on the Q4 2025 call. Conditional on the new combined Board; no later call in this set. |
| “We'll be, call it, 10% to 15% exposure to Waha at that point going forward.” | Devon Energy Corporation, Q1 2026 Earnings Call, May 06, 2026 · 2026-05-06T15:00:00 | Jeffrey Ritenour | pending | Tied to Blackcomb coming online later in 2026. On the Q2 2025 call Ritenour put direct in-basin Waha exposure at less than 15%. |
| “we expect to deliver $1 billion in annual pretax run rate synergies by year-end '27” | Devon Energy Corporation, Q4 2025 Earnings Call, Feb 18, 2026 · 2026-02-18T16:00:00 | Clay Gaspar | pending | Reaffirmed on the Q1 2026 call, where Gaspar declined to raise the number or accelerate the date and described it as the floor rather than the ceiling. |
| “In less than a year, we have captured 85% of our $1 billion target, and we are firmly on track to achieve the remaining savings during 2026.” | Devon Energy Corporation, Q4 2025 Earnings Call, Feb 18, 2026 · 2026-02-18T16:00:00 | Clay Gaspar | kept | On the Q1 2026 call Gaspar said the $1 billion target will be achieved well ahead of schedule. |
| “Looking specifically at the first quarter, we expect production to average around 830,000 BOE per day.” | Devon Energy Corporation, Q4 2025 Earnings Call, Feb 18, 2026 · 2026-02-18T16:00:00 | Jeffrey Ritenour | unknown | The Q1 2026 call reported oil at 387,000 barrels per day, the top end of guidance, but did not state a total BOE figure for the quarter. |
| “we anticipate capital investment of $3.5 billion to $3.7 billion, a reduction of $500 million compared to our maintenance capital levels just 1 year ago.” | Devon Energy Corporation, Q3 2025 Earnings Call, Nov 06, 2025 · 2025-11-06T16:00:00 | Jeffrey Ritenour | pending | Full-year 2026 guidance was left unchanged on the Q4 2025 call. Q1 2026 capital came in 6% below the midpoint of quarterly guidance, and combined-company guidance was deferred to mid-June. |
| “We'll continue to target share repurchases of $200 million to $300 million per quarter” | Devon Energy Corporation, Q3 2025 Earnings Call, Nov 06, 2025 · 2025-11-06T16:00:00 | Jeffrey Ritenour | missed | The Q1 2026 call disclosed that both companies paused their repurchase programs between the merger announcement and close, building cash instead. The pause was deliberate and disclosed, and management said repurchases would resume above legacy levels after close. |
| “We now expect full year oil volumes to range from 384,000 to 390,000 barrels per day” | Devon Energy Corporation, Q2 2025 Earnings Call, Aug 06, 2025 · 2025-08-06T15:00:00 | Jeffrey Ritenour | kept | The Q3 2025 call said full-year production expectations were raised every quarter of 2025, and the Q4 2025 call reported oil above the top end of the Q4 guide and 9,000 barrels per day above preliminary full-year guidance. |
| “we expect our business to achieve $1 billion pretax free cash flow and sustainable annual improvements by year-end 2026 as compared to our previously guided 2025 baseline” | Devon Energy Corporation, Q1 2025 Earnings Call, May 07, 2025 · 2025-05-07T15:00:00 | Jeffrey Ritenour | kept | Tracked at 40%, more than 60% and 85% on the following three calls, then declared achieved ahead of schedule on the Q1 2026 call. |
| “we are confident that we can save more than $2 million in D&C cost per well” | Devon Energy Corporation, Q4 2024 Earnings Call, Feb 19, 2025 · 2025-02-19T16:00:00 | Clay Gaspar | kept | On the Q2 2025 call Gaspar said Devon had fully captured $2.7 million in savings per well from the Eagle Ford joint venture dissolution. |
| “we anticipate spending to be between $4 billion and $4.2 billion for the year” | Devon Energy Corporation, Q3 2024 Earnings Call, Nov 06, 2024 · 2024-11-06T16:00:00 | Jeffrey Ritenour | kept | The 2025 soft guide was cut to $3.9 billion on the Q4 2024 call and reduced twice more during 2025; the Q4 2025 call reported full-year capital nearly $500 million below preliminary guidance. |
| “we'll initiate a $2.5 billion debt reduction program” | Devon Energy Corporation, Q2 2024 Earnings Call, Aug 07, 2024 · 2024-08-07T15:00:00 | Jeffrey Ritenour | pending | The Q3 2025 call reported nearly $1 billion retired against the target. The figure is not restated on the Q4 2025 or Q1 2026 calls. |
Q&A pressure map
Question counts and firms are curator tallies; analyst coverage shown above.
| Topic | Questions | Firms | Pressure / response |
|---|---|---|---|
| Capital returns mix: buybacks, dividend and the balance sheet | 14 | Wolfe Research, Barclays Bank PLC, JPMorgan Chase & Co, RBC Capital Markets, BofA Securities, Truist Securities, Capital One Securities, Johnson Rice & Company | The most persistent line of questioning in the set, present on every one of the last eight calls and pressed hardest by Wolfe Research, which has argued across multiple quarters that debt reduction should rank ahead of buybacks. Management's answer has been consistent to the point of repetition: all of the above, fixed dividend first, $200 million to $300 million of quarterly repurchases, balance to the balance sheet. That framework is now suspended pending new Board approval. |
| Business optimization mechanics and what remains to be captured | 13 | Goldman Sachs, JPMorgan Chase & Co, Wolfe Research, Citigroup, Barclays Bank PLC, BofA Securities, Scotiabank, TD Cowen, Raymond James, BMO Capital Markets | From Q1 2025 onward, Goldman Sachs has opened nearly every call on this topic and others have probed the individual buckets, especially the commercial and production categories where the accounting is least visible. Management answered these in detail, including a published scorecard. One clear non-answer: when Citigroup asked on the Q3 2025 call whether the 2025 turn-in-line count less 20 was the right starting point for 2026, Gaspar said he did not know if they wanted to get into that detail and redirected to the published preliminary guide. |
| Merger integration, synergy credibility and the portfolio review | 8 | Wolfe Research, JPMorgan Chase & Co, Goldman Sachs, UBS Investment Bank, BMO Capital Markets | Concentrated entirely in the last two calls, and the area where the gap between question and answer is widest. Analysts asked for review criteria, a timeline, a view on the gas-weighted mix, and whether the synergy target could move; management gave process descriptions and deferred substance to the new Board. Wolfe Research prefaced both of its Q1 2026 questions by predicting they would not be answered, which is a fair reading of what followed. |
| Macro view and activity discipline | 8 | Goldman Sachs, Citigroup, RBC Capital Markets, Barclays Bank PLC, Pickering Energy Partners | Analysts have repeatedly tested what would make Devon change activity in either direction. The answers have been unusually specific: a roughly $45 corporate breakeven including the dividend, a low-$50s WTI trigger for more aggressive action named in Q1 2025, and an explicit refusal in Q3 2025 to add barrels into what management called a well-supplied market. |
| Permian gas takeaway and Waha realizations | 6 | Goldman Sachs, Citigroup, William Blair & Company, Raymond James, Johnson Rice & Company | A margin question rather than a strategy question, and one management has answered with specifics each time: Matterhorn and Blackcomb commitments, capacity moved beyond Katy into Louisiana, ERCOT-indexed and LNG-indexed sales agreements, and curtailment of the gassiest wells when Waha turns negative. |
| Inventory depth and durability | 5 | BofA Securities, Scotiabank, Wolfe Research, Tudor, Pickering, Holt & Co., UBS Investment Bank | Analysts have tested the ten-year runway claim in the Delaware, the Williston after Grayson Mill, the Anadarko and now the combined portfolio. Management has consistently declined to put a new number on it, most recently on the Q1 2026 call where Raines said more work was needed before giving a pro forma figure. |
Language shifts
Only language evidence verified against the referenced component is shown.
| Observation | Verbatim evidence | Call ID | Component |
|---|---|---|---|
| Macro caution peaked with the Q3 2025 preliminary 2026 budget, when Gaspar reached for storm imagery and the strongest supply language in the set to justify holding a maintenance program. | “We look like the market is exceptionally well supplied, maybe potentially oversupplied.” | 1961821481 | 10 |
| Two quarters later the well-supplied framing is gone, replaced by an acknowledgment that conditions changed with no new directional call attached to it. Management still says it steers on the back of the curve. | “Certainly, over the last couple of months, that dynamic has changed very significantly.” | 1993912781 | 61 |
| The caution vocabulary first appears in Q1 2025, when Gaspar named a low-$50s WTI trigger and adopted a readiness phrase he has not repeated since. | “consider us on high alert at this point” | 1936451390 | 51 |
| New portfolio-rationalization vocabulary in the latest call. Devon has long described itself as an active buyer and seller, but this is the first time an asset-by-asset competitive test is stated as a formal review of the whole portfolio. | “Every asset in the combined portfolio has to compete for its capital and earn its seat at the table.” | 1993912781 | 2 |
| Under direct pressure to upgrade the synergy target, Gaspar used unusually flat, restrained phrasing, in contrast with the expansive language used elsewhere on the same call. | “I am not raising the number on the $1 billion. I'm not accelerating the time line.” | 1993912781 | 56 |
| Management named its own dropped topic and gave a reason, which is the cleanest available evidence for reading the refrac silence as a ranking change rather than a disappointment. | “we've probably gone quieter on refracs over the last several quarters” | 1993912781 | 23 |
Across twelve calls the pattern is a management team that sets a public number, reports against it every quarter, and delivers. The $1 billion business optimization target was met ahead of schedule after open skepticism, and that record is now the main argument for the $1 billion Coterra synergy target. What the transcripts do not yet contain is the shape of the combined company: the portfolio review has no criteria weightings, no timeline and no perimeter, and the capital return framework is suspended until the new Board acts. Mid-June combined guidance is the next real checkpoint.
Competitors describe Devon Energy Corporation's market in their own filings and calls. These verified passages and visual pages show where their strategies meet, using source documents preserved in Sources.
ConocoPhillips (COP)
The largest operator in the Lower 48 and the peer whose asset map overlaps Devon's almost line for line: 782,000 net acres and 661 MBOED in the Delaware Basin, plus Eagle Ford, Bakken and Midland positions, and an Anadarko package it sold in 2025. It is also the loudest voice arguing that U.S. shale is splitting into inventory "haves and have-nots" — the frame every mid-cap, Devon included, is being sorted by. Exhibits are confined to the Lower 48 shale business; Alaska/Willow, Qatar and Canadian LNG commentary is left out.
A rare public cost-of-supply number for the basin that is Devon's largest asset. Answering Citi, COP's head of Lower 48 puts new Delaware Basin development at a low-to-mid $30s cost of supply and Eagle Ford refracs in the mid-to-upper $30s, a $2–$5 gap. "Cost of supply" is ConocoPhillips' internal metric — a WTI breakeven that includes capital, operating cost and its own hurdle return — so it is not directly comparable to a peer's quoted breakeven unless the definitions are matched, and it reflects COP's specific acreage and scale, not the basin average. Read as a benchmark rather than a market price: it is the level a competitor with 782,000 Delaware net acres says it is drilling at today.
Analyst (Citi) and Nicholas G. Olds (Executive Vice President, Lower 48): I wonder if I can get you to talk about the attractiveness of incremental capital in the Delaware versus refrac opportunities in the Eagle Ford. How would you compare and contrast those? […] If you look at the Delaware and Eagle Ford, they are quite different. On refracs in the Eagle Ford, we typically do 50 or 60 in a year. You can execute one for about 60% of a development well’s cost and get roughly a 60% uplift on that original completion on your EUR. In that case, you are looking at mid-$30 cost of supply—upper $30s for refracs. In the Delaware, which is some of our lower cost of supply, you are executing currently in the low to mid-$30s. Overall, Delaware will have a stronger return than a refrac, but they are very close—we are talking probably $2 to $5 difference in cost of supply. Both are very competitive in the portfolio.
p. 11 · Read in context →
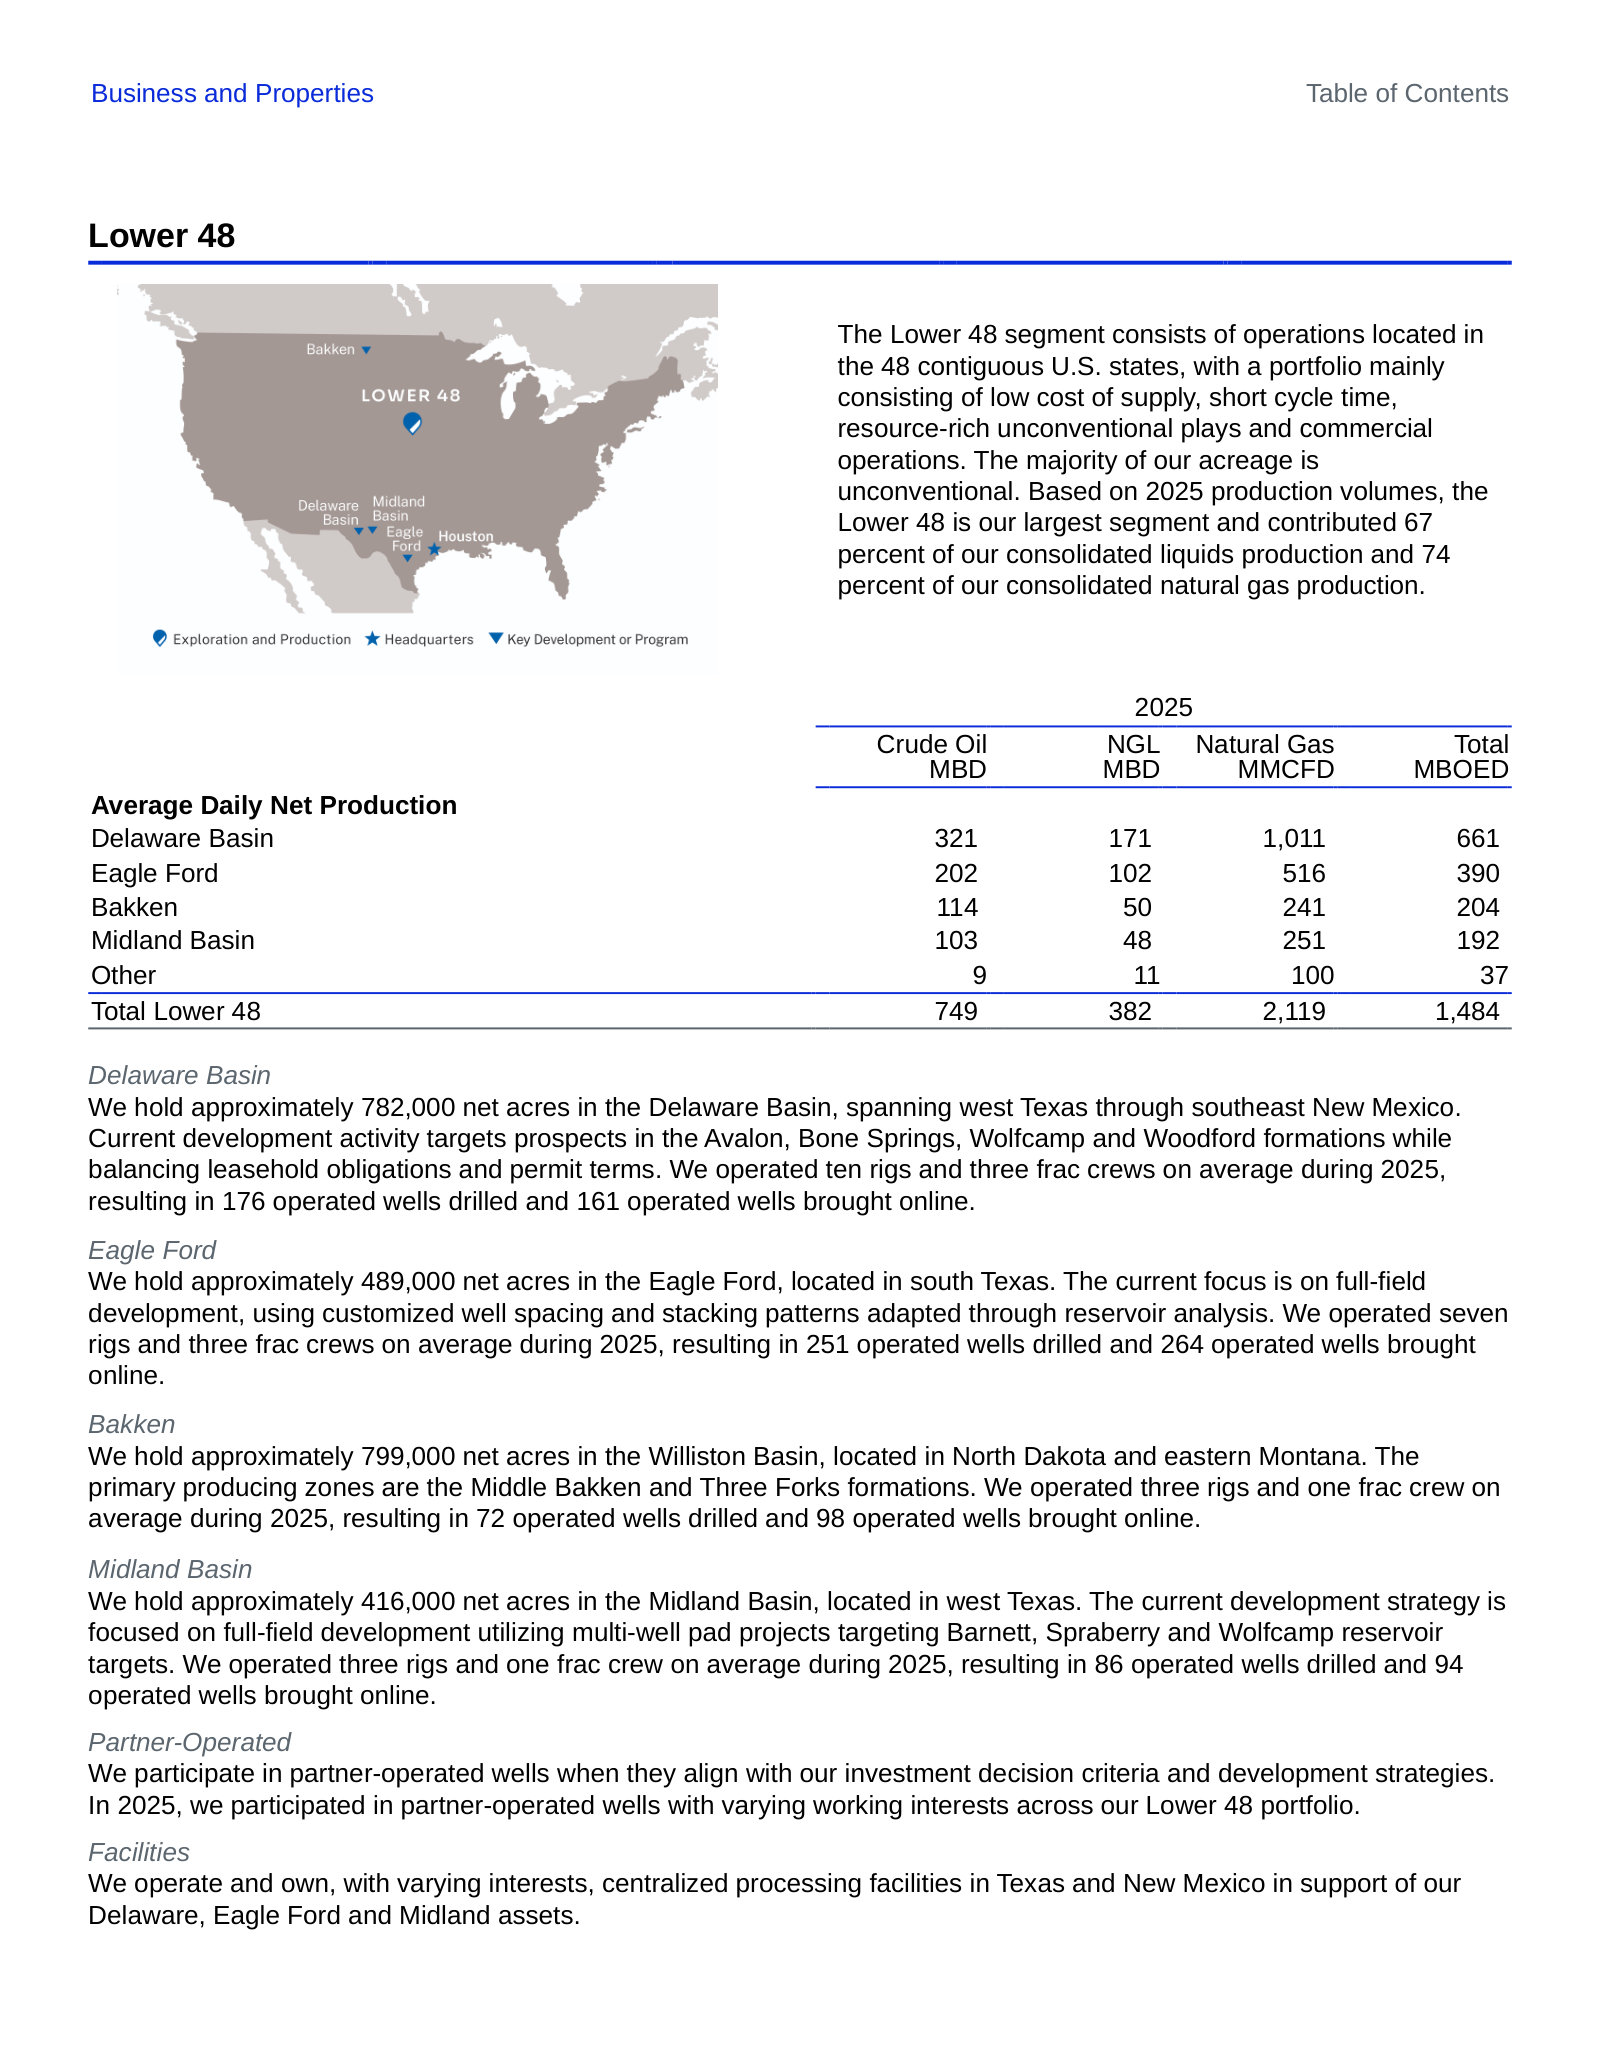
Permian Resources Corporation (PR)
The purest head-to-head competitor Devon has in its core asset: a Delaware Basin-only operator with roughly 480,000 net leasehold acres in West Texas and New Mexico, drilling the same Bone Spring and Wolfcamp intervals in the same counties. It competes with Devon twice over — for barrels and for acreage, since it describes itself as the natural buyer of Delaware assets that come to market. Exhibits are confined to Delaware Basin cost, strategy and A&D commentary.
Goldman asks Permian Resources directly whether it is a consolidator or a seller, and the co-CEO answers on the record: "given our leading cost structure, we've always seen Permian Resources as the logical consolidator of Delaware Basin assets today." This is the exhibit that matters most for Devon's acquisition pipeline rather than its production — it is a competing bidder stating that it intends to be the buyer of Delaware packages, and citing a cost advantage as the reason it can pay more for the same rock. Management also names its recent deals (Barilla Draw, the Apache bolt-on) and, in the same answer, leaves the door open to selling the company, so the statement is a positioning claim rather than a commitment.
Neil Singhvi Mehta (Analyst, Goldman Sachs) and James H. Walter (Co-CEO): There's been a lot of talk about mergers and acquisitions in some of the larger cap conference calls, and I’d like your perspective. You have effectively consolidated assets with strategic bolt-ons and transformative mergers and acquisitions. Do you see Permian Resources as a consolidator or potentially as a seller in the future? I understand it's a complex question, but I believe it's an important one. […] No, that's a fair question and a good one. I think given our leading cost structure, we've always seen Permian Resources as the logical consolidator of Delaware Basin assets today. Frankly, we're really excited about that opportunity set and what's in front of us. We talked about it, but our ground game efforts remain strong. We continue to find larger scale acquisitions like the Barilla Draw acquisition last year, the Apache bolt-on earlier this year, and several hundred million dollar deals in between. We're confident that our pipeline remains robust, and we'll be able to find those types of attractive acquisitions that enhance our business. While we don't have a perfect crystal ball, I would say we're really excited about the opportunities available as a consolidator in the Delaware.
p. 5 · Read in context →
Diamondback Energy, Inc. (FANG)
The Permian scale peer that anchors the inventory-depth and cost-curve debate Devon is priced against. Its acreage is Midland-weighted (about 775,000 of 869,000 Permian net acres) rather than Delaware, so the direct rock overlap is smaller than PR's, but it competes with Devon for the same Permian services, the same private acreage packages and the same investor dollar, and its management is the most explicit in the group about where U.S. shale productivity is heading. Exhibits are limited to Permian inventory, cost and macro commentary; Viper minerals and midstream discussion is left out.
Diamondback's stated rationale for moving to growth in Q1 2026 — adding two to three rigs and a fifth completion crew into an oil supply disruption. The competitive claim is the second half: "the best inventory quality and depth in North America, executed at the best cost structure." That is management's own characterisation with no peer comparison or metric attached, and it is the same superlative several companies in this tab apply to themselves. What is checkable is the behaviour it justifies: a large Permian operator choosing to add activity rather than harvest the price, which is the supply response that determines whether the whole basin's service costs and realised prices hold.
Neil Singhvi Mehta (Analyst, Goldman Sachs) and Kaes Van't Hof (CEO): There are macro and micro elements. From a macro perspective, there is a clear market signal. We are two months into the world’s largest oil supply disruption in history, and while Diamondback Energy, Inc. is solely based in West Texas and somewhat of a tourist in this situation, it is a very serious event with a lot of oil supply off the market. If that is not a signal to grow production in an advantaged area like the Permian Basin, I do not know what is. […] On the micro, Diamondback Energy, Inc. has the best inventory quality and depth in North America, executed at the best cost structure. If this is not the time to grow now, then when?
p. 1 · Read in context →
Diamondback's view of the shape of the U.S. shale cost curve, and it is not a bullish one for the field as a whole: management says the cost curve is moving up, that efficiency gains are running into "geologic time," and that there are "signs of degradation in productive quality across the U.S." It holds its mid-cycle deck at mid-$60s WTI, mid-teens NGLs and $3 gas despite the price spike. The degradation claim is qualitative — no basin, vintage or productivity series is cited — and it is made by a company whose thesis depends on being at the low end of that rising curve, so it is self-serving as well as informative. The first paragraph is the frame it applies to itself and, by implication, to every operator ranked below it on inventory quality and depth.
Kaes Van't Hof (CEO) and Derrick Whitfield (Analyst, Texas Capital): The operator with the best inventory quality, lowest cost structure, and longest inventory depth has the right to grow organically and create shareholder value. We have been looking to hit the organic growth accelerator for a while but did not have macro support. […] Also, what are you seeing in degradation of inventory quality across the Permian, clearly beyond Diamondback Energy, Inc.?
Kaes Van't Hof (CEO):
We are long-term bullish. Within three months, we went from a projected largest oversupply (which was debatable) to the largest undersupply, and we are only two months in. It is hard for us to move off our mid-cycle framework—mid-$60s WTI, mid-teens NGLs, and $3 gas with Waha differentials. Energy security is becoming more important, meaning more landed storage and the U.S. barrel being more important than ever. We think the U.S. shale cost curve is moving up. Operators have done a good job with efficiencies, but geologic time catches up and there are signs of degradation in productive quality across the U.S. Our job is to keep Diamondback Energy, Inc. at the low end of the cost curve, with top-tier inventory depth and quality and low execution costs. We are very well positioned. It is too early to raise mid-cycle pricing.
p. 7 · Read in context →
BMO puts the "peak Permian" question to Diamondback directly — who has inventory to grow and who does not — against the company's disclosed claim of nearly two decades of inventory at its 2026 pace. Management does not convert that into a sustainable growth rate; it describes a "yellow light" posture in which oil production is the input and capital flexes around it, and points to the Barnett as an addition to inventory duration rather than near-term volume. The two-decade figure is Diamondback's own inventory count at its own pace and location assumptions, which is exactly the kind of number that is not comparable across operators. The exchange is useful mainly as evidence of how the sell side is now scoring Permian operators — on years of inventory, not on production.
Phillip Jungwirth (Analyst, BMO) and Kaes Van't Hof (CEO): And then you called out Diamondback having nearly 2 decades of inventory at its 2026 pace. Last year, there was a lot of talk about peak Permian, who has inventory to grow, who doesn't. But for Diamondback, assuming a green light scenario, just how do you think about a sustainable growth rate that can be achieved for the company over a multiyear period given the depth of resource you have? […] Yes. I mean, listen, I think it's highly dependent on the macro. But in general, it feels like investors over time want some form of growth. Now we've done it on a per-share basis for the last few years. At some point, organic growth is going to come into the equation. Unfortunately, we're still stuck in this yellow light and this stoplight analogy that we can't shake yet. But I think there's probably a world where if we can efficiently allocate capital and growth becomes the output, that's probably a good decision. I think for 2026, we're starting the year here still in this kind of quasi-yellow light where oil production is the input and then CapEx will be reduced if things go well and held steady if things go as planned. But it could be a world where we hold CapEx flat and see what growth comes out of it. But that day is not today. But there will be a time, and that's why every day, we think about inventory, inventory duration, inventory growth and things like the Barnett, which is getting a lot of airtime today, are accretive to that long-term duration story.
p. 5 · Read in context →
Expand Energy Corporation (EXE)
The largest independent natural gas producer in the U.S. by net daily production, and Devon's most significant new competitor after the Coterra merger brought a Marcellus position in Northeast Pennsylvania into the portfolio. Expand operates in the same Northeast PA window and is contracting the same PJM power and LNG demand Devon's gas would serve. Exhibits cover its gas market sizing, its Appalachian positioning and its supply contracting; Haynesville-only operational detail and Western Haynesville appraisal commentary is left out except where it frames the market.
A competitor sizing the gas market Devon's Marcellus barrels now sell into. Three claims to separate: the demand thesis (AI power, industrial reshoring, LNG), a specific Appalachian number — Northeast demand growth of 4 to 6 Bcf per day, which management ties to unlocking pipeline-constrained production — and a share claim, that per third-party reports Expand owns 72% of the lowest-breakeven inventory in the Haynesville. The 72% figure is a share of a sub-set defined by an unnamed third party's breakeven cut, not a share of the basin, and the 4–6 Bcf/d is a company forecast with no date attached. The structural point stands on its own: the operator arguing loudest that Northeast gas is takeaway-constrained is also the one positioned to benefit if in-basin demand, not new pipe, is what clears it.
Michael Wichterich (President and Chief Executive Officer): There is no disputing our industry is in the midst of a major demand growth. The big 3 drivers of demand, AI power, the reshoring of heavy industry and global LNG growth are converging to make the future bright for natural gas. All of this was happening even before the recent events of the Middle East. So now in addition to structural demand growth, energy security has pushed U.S. natural gas to the forefront. Expand is uniquely positioned to take advantage of these events. Simply put, we have positioned ourselves to be in the right place at the right time. For example, our Gulf Coast assets sit at the epicenter of LNG. In fact, our largest customers today are LNG facilities, and there is an increasing recognition of the strength and competitive advantage of our Haynesville position. According to third-party reports, today, we own 72% of the lowest breakeven inventory in the basin, allowing us to deliver certified natural gas directly to LNG facilities with minimal risk of basis blowouts. Fundamentally, we see LNG as a natural extension of our business. Demand in the region is not just LNG; AI-driven power and industrial demand is rapidly growing in the region. When you combine structural demand growth and energy security, we believe the Gulf Coast is well positioned to become a premium price market. Our Appalachia assets sit at the core of AI power demand. We believe the Northeast will soon see demand growth of 4 to 6 Bcf per day. In-basin demand growth will unlock pipeline-constrained production. We're also seeing a renewed optimism to build infrastructure to serve more Americans in the Northeast and Southeast markets. In-basin demand growth, combined with new infrastructure, will unleash our low-cost inventory and create substantial value for both Expand and our shareholders.
p. 1 · Read in context →
Expand's own statement of scale and market reach, from the same prepared remarks. Two claims: that it is the largest natural gas producer in North America — its 10-K makes the narrower and more defensible version, largest independent U.S. producer by net daily production — and that "nearly 90% of expected U.S. demand growth can be served by our assets." The 90% is a statement about geographic proximity of its Haynesville and Appalachian acreage to expected demand centres, not about contracted volumes or won business, and no source or demand forecast is given. The argument management builds on it is the commercially relevant one for any competing gas seller: that counterparties signing 15- and 20-year supply agreements will select on producer scale, inventory depth and balance sheet, which is a barrier a smaller Marcellus position has to answer.
Michael Wichterich (President and Chief Executive Officer): We have no doubt that Expand is built for this moment. Why? We're the largest natural gas producer in North America. Counterparties want to do business with someone who's going to be around for the next 20 years. The depth of our portfolio, combined with our investment-grade balance sheet, provide that confidence. We are in the right place at the right time. Nearly 90% of expected U.S. demand growth can be served by our assets. Lastly, we have a team that can execute. We reset the economics of our Haynesville position last year. And today, we continue to see opportunities to strike more value from every dollar of capital we deploy across our portfolio.
p. 2 · Read in context →
The most direct exchange in this tab about the acreage Devon acquired with Coterra. BMO frames it plainly — Expand is dominant in the Haynesville "but there's certainly larger competitors up there in Appalachia" — and management answers by splitting the basin: Northeast PA, where it says it is dominant and is in active negotiations with PJM power providers, versus Southwest Appalachia, where it concedes "some of our other competitors are further east" and positions itself only on the western side. Both the dominance claim and the geographic split are management's own; no production or acreage share is offered. What it establishes is that the Northeast PA power-supply contracts are being competed for now, by a counterparty with materially more gas to sell.
Phillip Jungwirth (Analyst, BMO Capital Markets) and Michael Wichterich (President and Chief Executive Officer): And then can you talk about what kind of role you see Expand playing i the Northeast for new power demand projects? I mean you clearly have the dominant position in the Haynesville, but there's certainly larger competitors up there in Appalachia. So just how do you see the opportunities for Expand here versus the Gulf Coast considering the different competitive dynamics? […] In general, when I think about the Appalachia, I think about it in two buckets because we have Northeast PA, where we actually are dominant in that particular area, and that's where our competitive advantage is on power generation, which is actually PJM, and that's the right market for it. And so we're definitely in negotiations and discussions with power providers in that area in particular. And again, we feel like we have a competitive advantage there. In Southwest Appalachia, location to the western side of that, we think we can be competitive on that side of the basin as some of our other competitors are further east. But the overall strategy is to focus on where we're the best. And so we're thinking about Northeast PA in that market.
p. 10 · Read in context →
EOG Resources, Inc. (EOG)
The multi-basin analog closest to Devon's shape after the Coterra merger: a Delaware Basin core, a large Eagle Ford position, and a deliberately built gas business (Utica, Dorado) aimed at the same LNG and power demand. It competes for the same Delaware and Eagle Ford acreage and, unlike the Permian pure-plays, argues that organic exploration rather than M&A is the cheaper way to add inventory — the direct alternative to the route Devon took. Exhibits exclude its international exploration (UAE, Bahrain, Trinidad) commentary.
EOG's sizing of the U.S. gas market and of its own resource base, from the Q1 2026 call. The market number is the transferable one: U.S. natural gas demand growing at a 3% to 5% compound annual rate through the end of the decade, driven by LNG feed gas and electricity load — a company forecast, offered without a source, but close to what Expand and Diamondback describe independently in this tab. The resource claim is EOG's own and rests on its assumptions: approximately 12 billion barrels of oil equivalent of resource potential generating better than a 100% direct after-tax rate of return at $55 WTI and $3 Henry Hub. "Resource potential" is not proved reserves and "direct after-tax return" excludes overhead and capitalised costs, so the figure is not comparable to a peer's reserve or inventory disclosure without restating both.
Ezra Y. Yacob (Chairman and Chief Executive Officer): On natural gas, nearterm pressure remains with Lower 48 storage levels above the five-year average. However, our medium- to long-term outlook remains positive. U.S. natural gas benefits from two durable structural tailwinds: rising LNG feed gas demand and increasing electricity consumption. We expect U.S. natural gas demand to grow at a 3% to 5% compound annual growth rate through the end of the decade and believe the previously forecasted potential for global LNG oversupply has been significantly reduced with the damage to LNG infrastructure abroad. Our investments in building a premium gas position to complement our oil business have us well positioned to supply these expanding markets. […] First, we have a high-return domestic and international asset base with deep, long-duration inventory. Across our multi-basin portfolio, we estimate approximately 12 billion barrels of oil equivalent of resource potential generating greater than a 100% direct after-tax rate of return at $55 WTI and $3 Henry Hub. Our disciplined capital investment allows us to pace development appropriately and direct capital towards the highest-return opportunities across the portfolio.
p. 2 · Read in context →
Where EOG says it is putting 2026 capital: the Delaware Basin, the Utica and the Eagle Ford, with more activity at Dorado. The half-sentence worth noticing is the Delaware one — "after adjusting our development strategy in 2025, we expect consistent well performance year over year" — an oblique reference to the spacing and co-development changes EOG made after weaker Delaware results, and a reminder that even the lowest-cost operators are still resetting how densely the same intervals Devon drills can be developed. The three-year scenario attached to it is EOG's own model: $55–$70 WTI, 5% cash flow and better than 6% free cash flow CAGR, and $10–$18 billion cumulative free cash flow through 2028.
Ezra Y. Yacob (CEO): Looking ahead, we have a disciplined plan for 2026. Our strategy prioritizes activity in the Delaware Basin, the Utica, and the Eagle Ford, while increasing activity in Dorado alongside continued international investment. Our Utica asset provides a compelling opportunity for value creation as we continue to identify additional upside from the Encino acquisition as well as advancing our technical understanding of the play. And in the Delaware Basin, after adjusting our development strategy in 2025, we expect consistent well performance year over year. […] Using WTI price ranges of $55 to $70 per barrel from 2026 through 2028, the updated three-year scenario delivers 5% cash flow and greater than 6% free cash flow compound annual growth rates, generating cumulative free cash flow of $10 billion to $18 billion and earning robust double-digit returns on capital employed.
p. 2 · Read in context →
Ovintiv Inc. (OVV)
The peer that ran the opposite portfolio play to Devon's over the same window: it sold its Anadarko Basin assets — a basin Devon still operates — and concentrated on the Permian and the Montney, while Devon added Marcellus gas and Permian scale through Coterra. Its Midland Basin position competes with Devon for the same private acreage packages, and its commentary is the most specific in this tab on what shale inventory is actually changing hands for. Canadian Montney operating detail is excluded except where it frames the portfolio choice.
Ovintiv's account of finishing a portfolio transformation into two basins, and the market claim underneath it: that roughly 80% of the remaining sub-$50 breakeven oil locations in North America sit in the Permian and the Montney. That is a whole-continent inventory statement made by a company that owns positions in exactly those two plays, with no source, breakeven convention or location-count methodology disclosed — treat it as a thesis, not a measurement. The checkable operational claim beside it is more useful: more than 3,200 Permian and Montney drilling locations added since 2023 at an average $1.4 million per net 10,000-foot location, without equity issuance. The closing paragraph is the same haves-and-have-nots argument ConocoPhillips makes, restated from a mid-cap position.
Brendan McCracken (President and CEO): Several years ago, we made the strategic decision to focus our portfolio and build highquality inventory depth in the Permian and the Montney. Approximately 80% of the remaining sub-$50 breakeven oil locations in North America are located in those two basins, bolstering our positions in these plays, where we have competitive advantage, means we can continue to deliver durable returns for many years to come. Since 2023, we've increased our Permian and Montney drilling inventory by more than 3,200 locations at an average cost of $1.4 million per net 10,000-foot locations, and we did it without diluting our shareholders or stressing our balance sheet. This inventory life expansion has been unmatched by our peers and leaves us with one of the most valuable inventory positions in the industry. […] As North American shale continues to mature, a very clear competitive advantage is emerging for companies like ours, that have already set their inventory position up for success, have a clean balance sheet and can access premium price markets and have a demonstrated track record that translates to leading edge efficiency and returns. That combination of attributes is truly differentiated.
p. 1 · Read in context →
More peer documents
Expand Energy — Q3 FY2025 earnings call — Q3 FY2025 · 13 pages · Page 2 walks through Expand's new demand-by-submarket slide and the Lake Charles Methanol deal — a 15-year gas supply contract won on depth of inventory, delivery scale and carbon intensity, which is the template for how long-dated demand is being locked up. · Open →
Expand Energy — FY2025 Form 10-K — FY2025 · 184 pages · Carries the audited version of the scale claim — "largest independent natural gas producer in the U.S., based on net daily production" — plus the developed/undeveloped acreage table by operating area, which is the way to size the Northeast Appalachia position against Devon's Marcellus. · Open →
Diamondback Energy — FY2025 Form 10-K — FY2025 · 239 pages · States the Permian acreage split precisely — approximately 869,036 net acres, of which 774,645 Midland and 94,391 Delaware — which is the check on how much of Diamondback's claimed inventory depth actually overlaps Devon's Delaware core. · Open →
Permian Resources — FY2025 Form 10-K — FY2025 · 157 pages · Gives the acreage behind the cost-leadership claims: roughly 480,000 net leasehold acres and over 105,000 net royalty acres, 67% Texas and 33% New Mexico, plus the Apache bolt-on terms and the schedule of acreage expiring over five years. · Open →
EOG Resources — FY2025 Form 10-K — FY2025 · 169 pages · Sets out the play-by-play acreage that EOG's exploration-over-M&A argument rests on — about 1.1 million net acres in the Utica including the 675,000 core acres from Encino, 565,000 in the Eagle Ford and 160,000 in Dorado — and the 2025 net well counts by area. · Open →
Ovintiv — FY2025 Form 10-K — FY2025 · 177 pages · Documents the divestitures behind the two-basin story — roughly 360,000 net acres of Anadarko sold for $3.0 billion and about 126,000 net acres of Uinta — giving a per-acre read on what a mature liquids-rich basin position is worth today. · Open →
Fit
Does not fit the framework (P1 not met)
The year-10 durability gate is not met, four votes to nil, at a trimmed-mean probability of 0.395 and a spread of 0.13. Confidence is high on the tally's own basis — two model families agreed, the trial was order-stable, and load-bearing spreads were at most 0.15. No exclusion hit, no China sensitivity flag, no name-mask divergence on a gate criterion, and the watchlist-only overlay is not set. One criterion, P2, is recorded cannot-determine.
The order of operations is what produced that answer: P1 not_met -> does_not_fit (gate; nothing offsets it). Six other criteria are met, including the diagnosis that the 2024-25 damage was mostly temporary. None of them can offset a gate, and the rest of this tab reports them anyway, because a reader is owed the full ledger and not just the binding line.
Universe and exclusions
The screen is clean on every check, and it is clean by a wide margin rather than narrowly.
U1, listing — met, four votes to nil. Devon Energy Corporation is a Delaware registrant, commission file 001-32318, whose common stock of $0.10 par value trades on the New York Stock Exchange under DVN [1]. The Coterra merger that closed on 7 May 2026 changed the asset base and the share count but left the listed security, the file number and the ticker unchanged. The Chinese-ADR branch of the test is not engaged.
U2, scale — met, four votes to nil, on either share count. The primary record shows 1,153,403,107 shares outstanding as of the 18 May 2026 record date [2]; at the $44.405 close of 29 July 2026 that is $51.2 billion, 5.1 times the $10 billion line. The deterministic feature file reaches $28.1 billion instead, because it multiplies the same price by the pre-merger FY2025 count of 633 million — 2.8 times the line. Devon's own June 2026 statement that an $8 billion repurchase authorisation represents "15% of our market value" implies roughly $53.3 billion [3]. Every basis clears. The feature file's staleness is reported in full under Data gaps because it contaminates yields, not the size screen.
Sources: derived — 1,153,403,107 shares outstanding at the 18 May 2026 record date [4] and 633 million FY2025 shares from the deterministic feature file, both at the 29 July 2026 close of $44.405; the third bar solves $8bn / 0.15 from management's own framing [5].
X1, car companies — not hit. Devon aggregates its US operating segments into one reporting segment and describes itself as engaged primarily in exploration, development and production of oil, natural gas and NGLs, with activities "solely focused in the U.S." [6]. All $16,786 million of FY2025 revenue from contracts with customers is oil, gas, NGL and marketing and midstream [7]. There is no manufacturing line. The counter-fact belongs in the same breath: the substantive shape the exclusion was written against — a price-taking, capital-heavy business that screens cheap on free-cash-flow yield — is present here, and it is carried into the year-10 gate below rather than smuggled into an exclusion whose written test it does not meet.
X2, promotional management — not hit; the test needs both prongs and only one is partly evidenced. Prong one, promise versus delivery, is mixed and is stated plainly: the variable dividend, described in May 2023 as paying as much as half of excess cash flow, was dropped on the Q3 2024 call and has not returned [8], and the $2.5 billion debt-reduction programme announced in August 2024 [9] has retired under $500 million of gross debt through March 2026 with the numeric target absent from the last two calls. Against that, 2025 capital came in $408 million below the low end of the initial $4.0 to $4.2 billion 2025 guide [10], and the $1.0 billion optimisation target was declared achieved on the Q1 2026 call, ahead of its end-2026 deadline [11]. Prong two fails outright: the chairman held 2,408,753 shares and the chief executive 941,724 at the 18 May 2026 record date [12], against guidelines requiring six times base salary for the chief executive and three times for other named officers [13]. The counter-fact: directors and executive officers as a group hold 0.46% of the shares outstanding, and no insider has bought on the open market since 4 March 2024 — including through the $26.80 low.
X3, structural decline — not hit. Revenue from contracts with customers ran $15,140 million, $15,919 million and $16,786 million across FY2023 to FY2025 [14]. The longest consecutive decline run in the visible history is two years, FY2019 and FY2020; the current streak is zero; the three-consecutive-year high-single-digit test is false. The trial's temporary probability of 0.71 sits far above the strongly-permanent trigger. The counter-fact: the FY2023 fall of 23.6% happened while production rose, so reported revenue is a weak proxy for structural health in this business in either direction.
X4, market darling — not hit. Devon carries a forward price-to-earnings ratio of 8.65, second-lowest in a seven-name US independent peer set and 21% below that set's median, and a price-to-sales ratio of about 3.3 times, fourth of seven — and the sales multiple is overstated, because trailing revenue holds only about two months of Coterra. The ten-year price chart is a series of round trips, not a compounding line. The counter-fact in the same breath: sell-side positioning is one-sided, with roughly 21 buy and 4 outperform ratings against 2 holds and no sells and a mean target near $59 against the $44.41 close, so the informational edge is thinner than the multiple suggests. The multiple and coverage figures come from dated web lookups on 2026-08-02, not from a filing page, and are recorded as such.
S1, China dependence — not flagged. China revenue is $0 of $16,786 million, China assets $0 of $31,599 million, and China employees zero of roughly 2,200 [15] [16]. The counter-fact: Devon's own forward-looking-statement language names China explicitly as a source of oil, gas and NGL price volatility through trade policy and tariffs [17], so the price Devon realises carries China exposure even though its revenue and asset base do not.
One labelling note, because it looks like disagreement and is not. The tally records no cross-family agreement on X1, X2, X3, X4 and S1: one seat from the second model family wrote "not hit" where the other three seats wrote "not met". The evidence and the finding are identical on both sides, and the name-masked seat matched.
Pattern match
Devon fits none of the reader contract's four setups. That is framing rather than verdict; it does not move a single criterion.
Cyclicals at the bottom. The shape is right and the rule is not: the pattern is written for large banks and explicitly excludes the adjacent cases, and this is a commodity producer whose output price is set outside the firm. The entry moment is also gone. The drawdown ran 43.0% from $47.03 on 31 July 2024 to $26.80 on 8 April 2025 and has since repaired to within 5.6% of the old peak.
High dividend yield plus high free-cash-flow yield. The dividend does not carry the case. At $1.28 a year on the post-merger rate against the $44.405 close, the yield is 2.88%, below the roughly 4% level at which the framework treats the dividend as a material part of the return — the rate is the $0.24 quarterly fixed dividend of 2025 [18] raised 33% within weeks of the merger closing [19], against a disclosed framework that sends roughly 70% of returns to dividends and buybacks [20]. The tally records P4c as not applicable for exactly that reason.
Healthcare and insurance forecasting errors. There is no repricing mechanism of the pattern's kind. An insurer refiles rates and the book readjusts on a regulated calendar; Devon's revenue reprices continuously with the commodity, with no contract-renewal, premium-reset or regulated-rate step to correct an industry-wide forecasting error. Devon also never cut its own numbers during the fall — it raised production guidance twice and lowered capital guidance three times.
Quality tech monopolies and duopolies on a fear dip. The market structure is the opposite of the pattern's. Devon is one of twenty operators charted in its own core basin and holds roughly 9% of that group's inventory locations, and it states plainly that certain competitors "have resources substantially greater than ours" [21].
The full anatomy of the drawdown sits in Dislocation and the recovery calendar in Clock.
The pillar ledger
Source: the run's deterministic fit tally, as recorded. Probabilities and spreads are shown only where the tally records them.
Year-10 gate (P1) — not met
Four votes to nil, at 0.395 trimmed mean across seat probabilities of 0.34, 0.36, 0.43 and 0.47 — a spread of 0.13. The name-masked seat, shown the same dockets with the company's name removed, returned 0.40 and the same verdict.
Here is the decisive point. The gate does not ask whether Devon is a good company or a cheap one; it asks whether year-10 revenue and adjusted free cash flow will both be higher than today's, with very high conviction, and it resolves any proper doubt downward. Four of the framework's five conviction sources return the wrong answer on the primary record, and the fifth cuts both ways.
- Price is set outside the firm. As of January 2026 Devon's oil was sold 71% short-term variable and 29% long-term variable — 100% variable, nothing fixed — and the filing states that "the vast majority of our production is sold at variable, or market-sensitive, prices" [22].
- Regulation is a cost, not an entry barrier. Devon does not expect compliance costs to affect its operations "materially differently than other similarly situated companies", while noting those costs have increased over the years and will likely continue to increase [23]. A cost floor that rises for everyone is not the licensing regime the framework's regulated-entry source describes.
- Capital intensity maintains a depleting base rather than fencing anyone out. Rigs, crews, materials and services are bid for in open markets against competitors with "resources substantially greater than ours" [24]. Capital expenditure plus acquisitions ran 25.6%, 56.0% and 23.3% of revenue across FY2023 to FY2025 [25].
- The reserve base is consumed inside the horizon. Proved reserves of 2,428 MMBoe at 31 December 2025 against 307 MMBoe produced that year is 7.9 years of life, and the ratio has sat between 6.2 and 8.1 years for the whole visible history [26]. Everything sold in year 10 has to be found or bought first.
Source: derived — year-end proved reserves divided by that year's production, from the FY2025 supplemental oil and gas disclosures [27] and the FY2021 [28] and FY2023 [29] equivalents for the earlier years.
The fifth source, long operating history, is present and is not decisive on its own. Devon was founded in 1971 and has been publicly held since 1988 [30] — 55 years, above the framework's 30-to-50-year band — but the asset base behind that history rotates continuously: Barnett out in 2020, Grayson Mill in for roughly $5.0 billion in 2024, Coterra in May 2026, and a portfolio review opened in June 2026.
The strongest surviving counter-fact, in the same treatment. Devon has replaced what it produces without buying it. Organic additions — extensions, discoveries and all revisions — totalled 2,083 MMBoe against 1,490 MMBoe produced over FY2019 to FY2025, or 140% — read across the FY2021 [31] and FY2023 [32] reserve rollforwards for the earlier years — reaching 188% in FY2025 alone [33]. The combined company claims more than ten years of highly competitive Delaware inventory at the current pace of development, on 746,000 net acres producing 863,000 Boe/d [34], and 2026 guidance of 1.355 to 1.405 MMBoe/d is roughly 65% above the 836 MBoe/d Devon produced standalone in 2025 [35]. Volume is not the doubt. Price is: the jury's deciding sensitivity, carried from Durability, holds 2025 volumes flat and reprices them at Devon's 2020 realisations, which cuts upstream sales 39.5%.
Two honesty notes the skeptic pass forces. The claim behind the price-taker finding was weakened: Devon's production guidance, its 100%-variable oil contract mix and the absence of any customer above 10% of sales all verified, but the 3.7% US, 0.5% world and 5.8% Permian share percentages could not be checked against the corpus and are not relied on here. The year-10 gate claim itself was also weakened, on a citation rather than on arithmetic — the transcript page behind management's inventory qualifier did not resolve, so that qualifier is dropped and only the February 2026 disclosure is used. Neither weakening touched the reserve-life, contract-mix or regulation arithmetic, which is what the four seats voted on. Full treatment in Durability and Business.
Consistency (P2) — cannot determine
Three seats recorded cannot-determine and one recorded not met; the name-masked seat recorded met, which is the widest divergence anywhere in the run and is why nothing here is promoted. The framework's measure is a rolling five-year average of adjusted free cash flow, and that series does not exist for Devon in this run. The named missing datapoints are set out under Contested and undetermined.
What can be computed is reported free cash flow — operating cash flow less capital expenditure — from the filed statements, and on that basis the rolling five-year average has risen through each of the only three windows available.
Source: derived — operating cash flow less capital expenditures from the filed Consolidated Statements of Cash Flows, FY2019 to FY2020 [36], FY2021 to FY2022 [37] and FY2023 to FY2025 [38]. These are reported, not adjusted, figures.
The three windows average $2,964 million with a coefficient of variation of 15.5%, and no year in the covered period is negative — including 2020, when Devon still generated $311 million at a WTI index of $39.59. The counter-fact sits in the same numbers. Single-year reported free cash flow ranged from $133 million in FY2019 to $5,988 million in FY2022, a 45-fold spread inside four years, and all three rolling windows share the FY2022 peak, so they are not three independent observations. On the three adjusted years that can be built, the series moves the other way: $2,027 million, $1,560 million, $1,661 million. Full working in Yield.
Dislocation and yield (P3a, P3b, P3c, P3d)
P3a — met, four votes to nil. A dated adverse event exists. Devon's own filing names the trigger: commodity prices in 2025 fell "driven primarily by economic uncertainty in global trade arising from geopolitical events and shifting trade policies, such as the imposition of tariffs by the U.S. and planned oil output increases by OPEC+" [39]. The stock fell 29.3% across four sessions from 2 to 8 April 2025 on 2.85 times median volume. The counter-fact: 45% of the peak-to-trough dollar loss was already embedded before 2 April, so the named event is the sharp end of a slide that began without one — and the whole episode has since closed, with the shares at $44.41 against the $47.03 peak.
P3b — not met, three votes to one. The capitulation gauge reads 1.92 times the trailing median, below the 2 times reference line, and it is located in the December 2024 leg rather than at the April 2025 low, where the twenty-day average reached only 1.45 times. The heaviest single session of the entire fall closed up 0.8%, and Devon traded more heavily on merger news in March 2026, at 2.87 times, than in any month of the drawdown. The dissenting seat's reasoning is the counter-fact and is a fair one: read daily rather than smoothed, the four April sessions averaged 2.85 times and peaked at 3.45 times, a compressed panic a twenty-day window cannot register.
P3c — not met, four votes to nil, and this is the arithmetic the framework cares most about. The balance sheet selects the bar: net debt of $7,005 million against EBITDA of $7,516 million is 0.93 times [40] [41], which is moderate, so the reference line is 10% rather than the 8-to-9% fortress line. Adjusted free cash flow for FY2025 is reported free cash flow of $3,119 million less $99 million of share-based compensation less the $1,359 million five-year average of cash acquisitions, or $1,661 million [42]. On the feature file's $28,108 million market capitalisation that is 5.91%, 409 basis points short of the line; the three-year average of 6.22% is 378 basis points short. Correcting the denominator to the post-merger $51,217 million widens the miss rather than closing it.
The counter-fact, in the same treatment. Devon's reported free cash flow of $3,119 million — the $3.1 billion the company itself markets [43] — is 11.1% on the same market capitalisation, above the bar. The adjustment, not the operations, is what puts the name below the line, and the whole of the adjustment's step-down traces to the $3,808 million Grayson Mill purchase entering the five-year window.
P3d — met, four votes to nil, at 0.615 with a spread of 0.01 — the tightest agreement in the run. Consensus forward free cash flow clears the bar on the corrected market capitalisation: 10% of $51,217 million is $5,122 million, and FY2027 consensus free cash flow of $7,417 million less $200 million of assumed combined share-based compensation less the $1,359 million trailing acquisition charge is $5,858 million, an 11.44% yield with a $736 million cushion. The counter-fact is the width of that assumption, not the commodity: scale the acquisition charge to combined revenue instead of carrying Devon's trailing dollar figure and the same consensus gives 9.88%, below the bar; double the trailing charge and it gives 8.78%. FY2027 consensus revenue was also cut 7.9% and earnings per share 4.4% in the thirty days before the quote date.
Source: derived — adjusted free cash flow is reported free cash flow less share-based compensation less the five-year average of cash acquisitions, built from the filed Consolidated Statements of Cash Flows [44]; consensus free cash flow is the vendor mean at the 30 July 2026 vintage. The two denominators are labelled on each bar and are not interchangeable.
Balance sheet and self-help (P4a, P4b, P4c)
P4a — met, four votes to nil. Devon can outlast a long weak-price stretch without being forced anywhere. The single material covenant caps total funded debt at 65% of total capitalisation; the actual ratio was 24.8% at 31 December 2025, and the $3.0 billion revolver was undrawn and extended to March 2030 [45]. Liquidity at the end of 2025 was $4.4 billion, $1.4 billion of cash plus the undrawn facility [46]. No maturity year through 2030 exceeds $1.0 billion on Devon's own schedule, and $1.21 billion once the legacy Coterra series are added [47]. Roughly 30% of returns go to the balance sheet by disclosed policy [48], and management describes the split as optimisable quarter by quarter — "different quarters can present different opportunities that we want to be nimble around" [49]. The counter-fact: the combined maturity schedule is this run's construction, not a filed statement — the first post-merger consolidated balance sheet arrives with Q2 2026 results on 4 August 2026, and it excludes roughly $2.6 billion of cash paid for Delaware acreage in May 2026.
P4b — not met, four votes to nil, and it is the framework's stated hard fail rather than a shortfall against a reference line. Period-end shares went from 382 million at year-end 2020 [50] to 1,153,403,107 at the 18 May 2026 record date [51], a rise of 202% driven by three equity-funded acquisitions: WPX in 2021, 37.3 million shares for Grayson Mill in 2024 [52], and Coterra in 2026. Share-based compensation is not the cause: it ran $99 million against $6,711 million of operating cash flow [53].
Sources: Consolidated Statements of Equity, FY2018 to FY2020 [54] and FY2022 to FY2025 [55]; the 2026 bar is the 1,153,403,107 shares outstanding at the 18 May 2026 record date [56].
The counter-fact, in the same treatment, and it is a real one. Between deals the buyback demonstrably shrinks the count. Devon retired 99,798 thousand shares for $4,393 million at an average of $44.02 under the $5.0 billion programme, taking period-end shares from 663 million at year-end 2021 to 622 million at year-end 2025, a 6.2% reduction [57], and the heaviest year by share count was 2025, at $34.07. Management has since upsized the authorisation to $8 billion and said on the Q1 2026 call that it was "positioned to increase repurchases activity beyond our legacy level, and capitalize on any discount to our intrinsic and relative value" [58]. The framework's answer is nevertheless mechanical: the mergers were all-stock, the count is rising, and a rising count from serial acquisition is a stated fail regardless of what happens between deals. The disclosed base repurchase of $1.0 to $1.5 billion a year is 2.0% to 2.9% of the corrected market capitalisation, roughly a quarter to a third of the flywheel the framework assumes at a 10% adjusted yield. Full treatment in Self-Help.
P4c — not applicable. The criterion activates on a dividend yield near 4% or a case that leans on the dividend; Devon's is 2.88%. Recorded regardless: cover is 4.3 to 5.0 times on consensus free cash flow, the fixed layer was paid straight through 2020's $2,671 million loss year, and the variable layer has not been paid since the third quarter of 2024, taking total dividends paid from $1,858 million in 2023 to $619 million in 2025 [59].
Diagnosis (P5) — met
Four votes to nil at 0.71, carried from the adversarial trial and not re-derived by the jury. Three blind judges reading opposing cited briefs returned 0.71, 0.68 and 0.78 for a temporary rather than permanent impairment; the mean is 0.723, the spread 0.10, and the reading-order gap 0.02 — temporary-first seats averaged 0.71 and permanent-first seats 0.73, which is what "order-stable" means here.
The arithmetic behind it survived the skeptic pass intact. At the 8 April 2025 trough the equity carried $12.66 billion of damage — 626 million shares at the peak times the $20.23 fall. The problem itself, taken from Devon's own net-earnings bridge, was an approximately $1.3 billion pre-tax realised-price effect [60], or $1,033 million after tax. Discounted at 10%, two years of that is $1.79 billion and a perpetuity of it is $10.33 billion; probability-weighted at 0.71 temporary, $4.27 billion. The gap at the trough was $8.39 billion, 66% of the fall. Devon's own filed 10%-discounted standardised measure of proved reserves fell only $1.0 billion, from $19,770 million to $18,765 million, over the same year [61].
The counter-facts sit inside the same treatment, and one of them is why the setup is gone even though the diagnosis holds. The skeptic weakened the current-price claim and its weakened form is what stands: at the $44.405 close the remaining damage against the July 2024 peak is $1.64 billion, below even the two-year temporary figure, so no positive gap survives at this price on any of the three scenarios — and on the last full session close of $42.66 the residual is $2.74 billion, leaving a $0.94 billion gap against the temporary case only. Separately, a per-unit margin gap survives at flat benchmark prices: Q1 2026 field-level cash margin was $27.78 per Boe against $30.16 a year earlier [62] even though WTI rose 1% and Henry Hub rose 38%, because gas realised 33% of Henry Hub against 70% a year earlier and NGLs 25% of WTI against 31% [63]. On the annual series the same measure fell from $29.63 per Boe in 2024 to $24.97 in 2025 [64]. Whether that gap closes is the first falsifier in the ledger below. Both cases are argued in full in Damage Math.
Instrument context (I1) — not verifiable
Stated as fact, not as advice, and recorded as not verifiable by all four seats because no options or volatility source sits in the document corpus. Listed DVN options exist beyond twelve months: from a Cboe delayed-quote file timestamped 1 August 2026, the 21 January 2028 expiry (17.6 months out) carried 20,715 contracts of open interest and the 15 December 2028 expiry (28.4 months) 8,595 — together 5.7% of the 517,330 contracts outstanding across all expiries. At-the-money implied volatility read 0.376 and 0.383 at those two expiries, below the framework's roughly 0.50 reference level; AlphaQuery's 180-day implied-volatility mean was 0.384 as of 31 July 2026. Bid-ask spreads and executable size at the 2028 expiries were not obtainable from any free source. Because none of this resolves to a filing page, the tally records the criterion not verifiable rather than met, and it never blocks or unblocks a pillar.
What a 3x-in-3-years would require
The tally computes no re-rating arithmetic for this run. Its own note, recorded verbatim: "Re-rating math unavailable because the applicable bar or normalized adjusted FCF is missing." The applicable bar is undetermined in the feature file, because balance_sheet_class returns unknown for a missing FY2025 EBITDA, and normalised adjusted free cash flow is not_computable for the reasons set out below. No substitute figure is offered in the tally's place.
What the surviving ledger does carry, labelled as consensus arithmetic rather than as the framework's target test: 10% of the corrected $51,217 million market capitalisation is $5,122 million a year of adjusted free cash flow, and FY2027 consensus reaches $5,858 million on Devon's trailing acquisition charge or $5,061 million on a revenue-scaled one — clearing the bar on the first convention and missing it on the second. The float retires in 6.9 years of FY2027 consensus free cash flow, against a framework reference of roughly three years, and in 34 to 51 years at the disclosed base repurchase rate.
The base rates come from Devon's own price history rather than from a projection. Across fifteen completed drawdowns of 35% or deeper since 1990, the median depth was 47.2% and the median time from peak to trough 4.9 months; thirteen of the fifteen regained the prior peak, at a median of 29.3 months, and only four of those thirteen did it inside eighteen months. Two never recovered at all.
Source: derived — a 30% reversal zigzag over 9,211 daily closes from 2 January 1990 to 29 July 2026, as computed for Clock; the price series excludes dividends, so total-return drawdowns are shallower than shown.
Against that, every published self-help mechanism lands inside eighteen months: a roughly $200 million synergy exit rate in December 2026 and a roughly $980 million run rate at the end of 2027 [65], on a management team that reached its standalone $1.0 billion optimisation target [66] ahead of its own end-2026 deadline [67]. None of that changes the gate, and none of it is a recommendation; it is the calendar the arithmetic would have to run on.
Contested and undetermined
Nothing was recorded as contested. The tally's contested list is empty. No criterion carries two live readings that the framework declines to resolve.
One criterion is undetermined: P2, adjusted free-cash-flow consistency. Three seats returned cannot-determine and one returned not met. Each seat that could not determine named the datapoint it lacked, and the three formulations are reproduced exactly as recorded:
- rolling five-year average of adjusted FCF (fit_features.fcf_stability empty: SBC missing FY2016-17, no complete consecutive five-year acquisition window)
- complete rolling five-year adjusted FCF stability series with SBC and acquisition adjustments
- rolling 5-year adjusted FCF stability series with complete SBC and acquisition inputs
They are the same absence under three descriptions. The deterministic derivation needs a consecutive five-year window with both share-based compensation and cash acquisitions present, and the structured cash-flow feed carries no acquisitions line at all and no share-based compensation before FY2018, so no window closes. Reported free cash flow can substitute for direction but not for the framework's measure, which is why three seats declined to call it rather than reading the proxy as an answer.
The name-masked seat recorded P2 as met, the one place in the run where masking changed a label. It did not touch a gate criterion, the tally records no gate difference under masking, and the maximum probability gap between the masked and unmasked reads is 0.035 — which is why prior_driven_risk is not set.
Two further criteria are absent for structural reasons rather than uncertainty. P4c is not applicable, because the dividend yield is 2.88% and the case does not lean on it. I1 is not verifiable, because no option-chain or implied-volatility source sits in the corpus. Both are stated above.
Provenance
Source: the run's deterministic fit tally, trial tally and refutation ledger, as recorded.
Two sentences on what that means for a reader who will not open the machinery. The verdict was reached by four jurors reading the same evidence dockets independently — two from each of two model families — plus a fifth juror shown the same dockets with the company's name stripped out, and the masked juror reached the same gate conclusion at almost the same probability, which is why the run carries no prior-driven-risk flag. Every claim the verdict turns on was handed to a skeptic that recomputed the arithmetic from the cited pages: four claims came back weakened and are reported here in their weakened form, one could not be verified at all and carries no weight, and none was refuted.
The falsifier ledger
These are the standing conditions that would change the read, reproduced exactly as recorded. Several are the same test nominated by more than one tab; the duplication is the ledger's, not this tab's, and nothing has been merged away.
Framework templates. Five generic conditions the system applies to every name.
| Condition (as recorded) | Threshold and direction | Window |
|---|---|---|
| adjusted FCF or EBITDA declines where flat-or-better was underwritten | Any sustained decline in adjusted FCF or EBITDA; cuts against | Not defined in the ledger |
| revenue declines for a third consecutive year | Three consecutive declining years; cuts against. Current streak is zero, longest run two years | Rolling, annual |
| capital allocation pivots to debt paydown over repurchases | Debt paydown displacing repurchases when the discount is widest; cuts against. Policy is roughly 30% to the balance sheet today | Rolling, quarterly |
| share count inflects upward | Any further rise; cuts against. Already triggered — plus 202% since year-end 2020 | Rolling |
| the industry repricing cycle fails to materialize where industry-wide mean reversion was underwritten | Absence of the assumed sector-wide reversion; cuts against | Not defined in the ledger |
Name-specific, with thresholds and windows as recorded.
| Condition (as recorded) | Threshold and direction | Window |
|---|---|---|
| FY2026/FY2027 total field-level cash margin fails to recover toward the 2024 $29.63/Boe level even at WTI above $70, i.e. the Q1 2026 $27.78/Boe gap persists - confirming per-unit margin loss rather than price [68] [69] | $29.63/Boe reference, WTI above $70; cuts against temporary | FY2026 and FY2027 |
| Permian gas and NGL realizations stay near 33% of Henry Hub and 25% of WTI through 2027 rather than normalizing as takeaway is added - making the residual-stream discount structural, not transient [70] | 33% of Henry Hub, 25% of WTI; cuts against temporary | Through 2027 |
| YE2026 proved reserves fall on non-price revisions, or the standardized measure drops materially at a flat SEC price deck - the one outcome that converts price mechanics into genuine asset impairment [71] | Non-price reserve revisions negative at a flat price deck; cuts against temporary | Year-end 2026 |
| 2027 exit run-rate synergies land far below the ~$980m target, or the $8bn repurchase goes largely undrawn - showing the post-Coterra per-share recovery depended on a promise rather than delivered cash [72] [73] | $980m run rate, $8bn authorisation; cuts against | Year-end 2027 |
| FY2026 or FY2027 proved reserves and standardized measure fall materially on non-price revisions under a flat SEC price deck. | Non-price revisions at a flat deck; cuts against temporary | FY2026 and FY2027 |
| Total field-level cash margin stays below $25/Boe, or Delaware stays below $26/Boe, despite WTI averaging at least $65. | $25/Boe company, $26/Boe Delaware, WTI at least $65; cuts against | Not defined in the ledger |
| The verified $1B optimization and Coterra synergy targets fail to convert into at least $4B annual free cash flow at mid-$60s WTI. | $4bn annual free cash flow at mid-$60s WTI; cuts against | Not defined in the ledger |
| Net leverage rises above 1.5x while dividend/buyback commitments are cut or deferred through year-end 2027. | 1.5x net leverage; cuts against | Through year-end 2027 |
| YE2026 or YE2027 standardized measure falls materially at a flat or higher SEC price deck, or proved reserves decline on non-price revisions - which would convert the FY2025 dip from price mechanics into genuine asset decay. | Standardized measure at a flat or higher deck; cuts against temporary | Year-end 2026 and 2027 |
| Field-level cash margin fails to recover toward the $29.63/Boe 2024 level through FY2027 even with WTI near $70, confirming that the Permian gas (33% of Henry Hub) and NGL (25% of WTI) realization gap is a permanent structural discount rather than a transient basis problem. | $29.63/Boe, WTI near $70; cuts against temporary | Through FY2027 |
| FY2027 free cash flow lands far below the ~$7.4bn consensus and Q4-2027 run-rate synergies fall well short of ~$980m, so that post-merger cash generation depends on issuing equity rather than on the assets - and the $8bn buyback goes largely undrawn. | $7.4bn consensus free cash flow, $980m synergies; cuts against | FY2027, fourth quarter |
| Devon adds further debt or equity to sustain volumes (another acquisition financed like Grayson Mill) while per-share FCF stagnates, showing that maintaining production now permanently requires outside capital. | Any further debt- or equity-financed acquisition alongside flat per-share FCF; cuts against | Not defined in the ledger |
Source: the run's falsifier ledger, reproduced verbatim; the threshold, direction and window columns parse each condition and add nothing to it. The four entries whose ledger text carried raw internal source references are shown with those references resolved to their filing pages.
The one condition already met is the fourth template: the share count has inflected upward and stayed there, which is the mechanism behind P4b.
Data gaps
The tally records forty-eight data-gap entries, most of them the same limitation reported independently by several tabs. Deduplicated, they are these.
The feature file's market capitalisation is wrong by a factor of 1.82, and it propagates. fit_features.market_cap multiplies the 29 July 2026 close of $44.405 by 633,000,000 shares taken from the FY2025 income statement — a count that predates the 7 May 2026 Coterra merger. The filed count is 1,153,403,107 as of the 18 May 2026 record date, giving $51,217 million rather than $28,108 million. Every yield the file divides by market capitalisation is overstated by the same factor: consensus_forward_yield reads 22.35% for FY2026 against 12.27% corrected, and 26.39% for FY2027 against 14.48%. The universe screen is unaffected on either basis. Both figures are stated wherever they appear on this tab; neither was silently substituted.
The framework's core yield arithmetic could not be recomputed by the deterministic derivation. fit_features.adjusted_fcf, adjusted_fcf_yield, yield_baseline, fcf_stability and float_retirement_years all return not_computable. The structured cash-flow feed carries a free-cash-flow field only for FY2016 and FY2017, no share-based compensation before FY2018 and no acquisitions line at all, so no complete consecutive five-year window exists; that feed also reports FY2017 free cash flow of $2,865 million against $2,909 million of operating cash flow, implying $44 million of capital expenditure, which is not credible and was not used. Every adjusted figure on this tab was rebuilt from the filed Consolidated Statements of Cash Flows in the FY2021, FY2023 and FY2025 Forms 10-K and is labelled as a derivation. Because the corpus holds no Form 10-K covering fiscal 2017 or 2018, the five-year acquisition average is computable only from FY2023 onward, so the yield baseline rests on three years rather than the five to seven the brief asks for. fit_features.balance_sheet_class returns unknown because FY2025 EBITDA is missing from the feed; it was computed here from the filed income statement at 0.93 times and cross-checked against the vendor actual at 0.95 times, both moderate. fit_features.share_count_trend uses weighted-average diluted shares rather than period-end shares and carries no 2026 observation, so it understates both the 2025 reduction and the entire Coterra dilution; this tab shows the period-end series. fit_features.capitulation_gauge measures the drawdown from a 31 July 2024 peak of $47.03 rather than the 7 June 2022 cycle peak of $78.04, so it reads minus 43.0% where the longer window reads minus 65.7%; both are stated.
No post-merger financial statements exist anywhere in the corpus. The latest Form 10-Q covers Q1 FY2026, filed before the 7 May 2026 close, and the latest Form 10-K is FY2025 standalone Devon; the first combined quarter reports on 4 August 2026. The FY2025 pro forma combined statement of operations is referenced in the 7 May 2026 Form 8-K but the exhibit is not indexed. Coterra's standalone financial statements, share-based compensation, acquisition history, reserves and inventory disclosures are absent entirely, so combined revenue, EBITDA, free cash flow, reserve life, organic replacement and any pro forma valuation multiple could not be read from a filing page. Combined debt, cash and liquidity here are assembled from the FY2025 footnote plus the 25 June 2026 Coterra note exchange, and exclude 2026 repayments, the roughly $2.6 billion May 2026 acreage payment and any legacy Coterra revolver. No corpus document states the size of the combined revolving facility or any post-merger covenant. The combined-company share-compensation deduction of $200 million a year is an assumption, not a sourced figure; it moves the FY2027 adjusted yield by roughly 20 basis points either way.
Consensus and market data are thin where the drawdown happened. The run's web-research provider returned HTTP 402 on every phase, so current market capitalisation, peer multiples, sell-side rating counts and production denominators come from direct dated lookups on 2026-08-02 and are recorded in the manifest rather than cited to a page. The CapIQ revision feed carries only trailing-180-day snapshots from 30 January 2026 onward, so no consensus revision path exists across the 2024-25 trigger window at all — the near-term hit is reconstructed from Devon's own dated guidance decks and the FY2025 net-earnings bridge instead. The 2026 snapshots straddle the merger re-basing, which moves FY2027 consensus revenue from $15.8 billion to $26.6 billion, leaving only the 29 June to 29 July 2026 pair directly comparable. The Visible Alpha driver set holds a single 2026-07-29 vintage with no pre-drawdown snapshot. No adjusted-free-cash-flow consensus is published, so the vendor's operating-cash-flow-less-capex mean is used as the proxy and named as such, and the commodity deck underlying it is undisclosed. No peer or sector price series is staged, so the claim that April 2025 repriced the whole industry rests on Devon's filings and contemporaneous reporting rather than measured relative performance. The 29 July 2026 bar used as "current" carries 200 shares of volume and a 4.09% move; the last full session, 28 July 2026, closed at $42.66.
Ownership, flow and instrument data. The short-interest dataset returned zero rows for reported positions, short-sale volume, public net-short disclosures, borrow pressure and peer context alike, so the short-interest figures used are third-party compilations of semi-monthly FINRA reports with approximate settlement dates. The insider record has a February-to-April 2026 gap between two feeds. The disposition of the 37.3 million shares issued to the Grayson Mill seller on 27 September 2024 is not disclosed, so whether that block became supply during the fall cannot be established. Long-dated option open interest and implied volatility come from Cboe and AlphaQuery files dated 1 and 31 July 2026 and carry no filing page; bid-ask spreads and executable size at the 2028 expiries were unobtainable, as Barchart, OptionCharts and MarketChameleon all block automated access.
Market structure and history could not be measured from primary sources. No named market-share statistics for US onshore exploration and production exist anywhere in the corpus; concentration is inferred from Devon's own 2026 estimated Lower-48 peer chart, which names nineteen listed operators and excludes ExxonMobil, Chevron and every private operator, combined with external production aggregates. Devon publishes no location-level inventory count with break-even bands after 2023, so the ten-year inventory assertion could not be reconciled to a well count at a stated oil price. Revenue history before FY2016 exists in neither the feature file nor the corpus, so a 55-year operating history could be charted for ten years only. The corpus holds no FY2018 to FY2020 annual reports, so the $2,956 million of FY2018 repurchases in the numeric feed has no page anchor and the executed-buyback record is fully cited only from FY2019. The corpus holds no forward commodity strip or independent mid-cycle price deck, so the temporary-versus-permanent split rests on the trial's ruling and realised-price history rather than a market-implied curve. Devon's standalone oil sensitivity was read off a machine-extracted bar chart in the 5 May 2026 deck rather than printed text.
Calendar items that are not yet knowable. No company-confirmed report dates exist for the third or fourth quarters of 2026; dates used elsewhere in the report are projected from the 2025 cadence and labelled indicative. The portfolio review announced at merger close has no published timetable — the June 2026 update commits only to updates "at the appropriate time" — so divestiture proceeds, their size, and whether they go to repurchases or debt paydown can be neither dated nor sized.
One retrieval limitation worth naming. The PageIndex substring engine returned zero hits on every query issued for the pillar work, so discovery relied on the semantic engine plus direct reads of the index page arrays, and convergence between the two retrieval engines could not be used as a materiality signal.
What This Tab Establishes
Devon Energy sells US onshore oil, gas and NGLs into globally priced markets — one reportable segment, four producing regions, no customer above 10% of sales. It clears the universe screen: NYSE-listed common stock of a Delaware corporation, roughly $51 billion of market value. It is not an auto OEM, carries no China revenue or assets, and trades below the peer median on forward earnings. The market-structure evidence points the other way: a price-taking producer with roughly 4% of US crude output.
Orientation — What Devon Actually Sells
Devon was founded in 1971 and has been publicly held since 1988. It is an independent energy company — no refining, no retail, no international operations — engaged in the exploration, development and production of oil, natural gas and natural gas liquids from onshore US shale acreage [1]. Two sentences a cold reader can repeat: Devon drills wells on acreage it owns or leases in four US basins, lifts hydrocarbons out of the ground, and sells them at prevailing market prices set elsewhere. It also buys and resells third-party volumes through a marketing arm that adds revenue at close to zero margin.
For financial-reporting purposes there is exactly one reportable segment. Devon's exploration and production activities are "solely focused in the U.S.," and its US operating segments are aggregated into a single reporting segment because the operations are so similar [2]. All of the roughly 2,200 employees are located in the US [3].
FY2025 Revenue ($M)
Market Value ($B)
2026 Production (MBoe/d, pro forma)
Employees
Sources: revenue from FY2025 Form 10-K, Note 1 Disaggregation of Revenue [4]; production is the midpoint of the combined-company 2026 guidance range [5]; employees per the FY2025 Form 10-K [6]; market value is share count from the 2026 proxy times the 2026-07-29 close.
The revenue split
FY2025 revenue from contracts with customers was $16,786 million, of which $11,223 million was Devon's own oil, gas and NGL production and $5,563 million was marketing and midstream — buying and reselling third-party volumes and moving them through gathering systems [7]. Marketing is a third of the top line and almost none of the economics: the segment note shows marketing and midstream expenses of $5,635 million against those $5,563 million of revenues in 2025 — a negative gross spread on the resale book [8]. Within upstream sales, oil is $8,906 million of the $11,223 million; gas is $842 million [9]. This is an oil company with a gas by-product and a pass-through trading desk attached.
Source: FY2025 Form 10-K, Note 1 — Disaggregation of Revenue [10].
Where the assets are
Four regions, one country. The Delaware Basin — southeast New Mexico and west Texas — is 59% of production and 57% of proved reserves; the Rockies (Williston and Powder River), the Anadarko Basin in western Oklahoma and the Eagle Ford in south Texas make up the rest [11].
Source: FY2025 Form 10-K, Property Profiles map and table [12].
Behind those volumes sit 2.4 million net acres, of which about 1.6 million are held by production and roughly 15% are on federal land, and 18,549 gross producing wells, of which Devon operates about 7,785 [13].
A different company than the filings describe
The corpus's most recent 10-K covers a company that no longer exists in that form. On May 7, 2026, Devon consummated an all-stock merger of equals with Coterra Energy, with each Coterra share converted into 0.70 Devon shares and Devon surviving as the registrant [14]. Devon put the combination at roughly $58 billion of pro forma enterprise value with $1.0 billion of targeted annual pre-tax synergies, and said the Delaware Basin would underpin over 50% of enterprise-wide production and free cash flow [15]. The deal added Coterra's 346,000 Delaware acres to Devon's 400,000 [16], and brought a Marcellus gas position Devon did not previously have: 190,000 pro forma net acres producing 330 MBoe/d [17]. Combined-company 2026 guidance is 1,355–1,405 MBoe/d total and 490–510 MBbl/d of oil [18].
Two consequences for reading the rest of this report. Every FY2025-and-earlier financial figure describes standalone Devon at roughly 836 MBoe/d. And the portfolio is being actively reshaped again: management says a "comprehensive portfolio review is well underway" with the intent to concentrate around the Permian and to "assess the optimal path forward for each of our other assets" [19].
Universe Screen (U1, U2)
U1 — listing and instrument: clean. Devon Energy Corporation is a Delaware corporation whose common stock, par value $0.10, is registered under Section 12(b) and trades on the New York Stock Exchange under DVN — a US primary listing of a US-domiciled operating company, not an ADR, not a Chinese issuer, and not a Chinese ADR [20]. Commission File Number 001-32318; the company is now headquartered at 840 Gessner Road, Houston, Texas, having moved from Oklahoma City with the merger [21].
U2 — market capitalisation: clears the $10B line on either basis, but the feature file's figure is stale. fit_features.market_cap_usd computes to $28.1 billion — 633.0 million shares (the FY2025 income-statement share count) times the $44.405 close of 2026-07-29. That share count predates the Coterra merger. The 2026 proxy states 1,153,403,107 shares outstanding as of the May 18, 2026 record date [22]. At the same $44.405 close that is $51.2 billion. Devon's own June 2026 statement corroborates the larger number: an upsized $8 billion repurchase authorisation described as "15% of our market value" implies about $53 billion [23]. Independent market data on 2026-07-31 put market capitalisation at $52.05 billion on 1.15 billion shares at $45.13.
The screen result is unaffected — $28.1 billion and $51.2 billion both sit well above $10 billion — but the same stale share count feeds every per-share and yield derivation in the feature file, so the discrepancy is recorded as a data gap rather than silently corrected here. The arithmetic that matters downstream: 1,153,403,107 × $44.405 = $51.2 billion, against the feature file's 633,000,000 × $44.405 = $28.1 billion — a 1.82× difference.
Market Structure — The Raw Material for Durability
Devon's own filings describe a fragmented, price-taking industry, and they have described it in near-identical words for five straight years. The FY2025 10-K: "Strong competition exists in all sectors of the oil and gas industry. We compete with major integrated and independent oil and gas companies for the acquisition of oil and gas leases and properties… Certain of our competitors have resources substantially greater than ours and may have established superior strategic long-term positions and relationships. As a consequence, we may be at a competitive disadvantage in bidding for assets or services and accessing capital and downstream markets" [24]. The FY2021 10-K carries the same passage almost verbatim [25]. Item 1's dedicated "Competition" heading contains no discussion at all — it is a one-line cross-reference to the risk factors [26].
Concentration, measured
Devon's own merger deck ranks 2026 estimated Lower-48 production across 19 named listed operators and puts pro forma Devon above 1.6 MMBoe/d, which places it second in that group, behind ConocoPhillips at about 2,350 MBoe/d [27]. Measured on the combined company's own 2026 guidance midpoint of roughly 1,380 MBoe/d [28], it sits fourth instead, behind ConocoPhillips, Occidental at about 1,450 and EOG at about 1,400 — the guidance the company issued four months after the deck is about 14% below the deck's own pro forma estimate.
Sources: peer figures from Devon's merger presentation, February 2026 [29]; the pro forma Devon bar is the midpoint of combined-company 2026 guidance [30].
Neither rank is concentration. The 19 named operators together produce about 13.1 MMBoe/d, so pro forma Devon is roughly 9.5% of the listed-independent cohort — and that cohort excludes ExxonMobil and Chevron, the two largest Permian producers, along with hundreds of private operators. On the measure that governs the price Devon receives, the share is smaller still: pro forma oil production of 490–510 MBbl/d [31] against US crude output of about 13.6 million b/d in 2025 is roughly 3.7%, and against world crude supply of roughly 103 million b/d it is about 0.5%.
Even inside its franchise basin the arithmetic does not reach oligopoly. The merger created "one of the largest operators in the Delaware Basin" with 746,000 combined net acres and 863,000 Boe/d of 3Q25 Delaware production at a 44% oil mix [32]. That is roughly 380 MBbl/d of Delaware oil against Permian-wide oil production averaging about 6.6 million b/d — under 6% of the basin it calls its franchise.
No pricing power, stated in the filing
Devon does not set the price of what it sells. "The vast majority of our production is sold at variable, or market-sensitive, prices" — 71% of oil under short-term variable contracts and 29% under long-term variable, with no fixed-price oil at all as of January 2026 [33]. The 10-K quantifies the resulting swing: over the last five years monthly NYMEX WTI ranged from over $120 per barrel to under $50, and Henry Hub from over $9.50 to under $1.60 per MMBtu [34]. Reported revenue traces that swing rather than any volume or share trajectory.
Revenue series as reported in company filings; FY2025 figure ties to the disaggregation note [35]. Series drawn from fit_features.revenue_trajectory; the FY2021 step reflects both price recovery and the WPX merger.
Customer concentration is absent in both directions. No customer accounted for more than 10% of sales revenue in 2025 or 2024, and Devon states that if a major customer stopped buying it "believes there are a number of other purchasers to whom the company could sell" [36]. Fungible product, interchangeable buyers — the definition of a commodity market rather than a franchise.
Regulatory barriers: a cost, not a gate
Devon's industry is heavily regulated, but the regulation is not of the kind that keeps entrants out. The 10-K frames it as expense: laws and regulations "increase the cost of doing business and consequently affect profitability," and Devon adds that it does "not expect such compliance costs or impacts to affect our operations materially differently than other similarly situated companies" [37], with capital and operating expenses tied to environmental rules having "increased over the years and will likely continue to increase" [38]. Named regimes include the BLM's 2024 flaring rule and the EPA's December 2023 methane standards, both under litigation and both potentially subject to repeal or modification [39]. A rule that raises every operator's cost identically is the opposite of a regulator-granted franchise; the roughly 15% of net acres on federal land [40] is a permitting exposure, not a protected position.
Capital intensity: a treadmill, not a moat
Capital intensity is real and Devon says so plainly: "The business of exploring for, developing and producing oil and natural gas is capital intensive. Because oil, natural gas and NGL reserves are a depleting resource, we, like all upstream operators, must continually make capital investments to grow and even sustain production" [41]. Capital expenditures including acquisitions were $4.0 billion in 2025 and $8.9 billion in 2024, against total revenues of $17.2 billion and $15.9 billion [42].
The distinction that matters for the durability question is what that spending buys. Devon's own risk factor states that "estimated proved reserves and future oil, gas and NGL production will decline materially as reserves are produced unless we conduct successful exploration and development activities," and notes that unconventional assets "generally have significantly higher decline rates as compared to conventional assets" [43]. Capital here maintains the existing position rather than walling off the market — the pipeline, utility or regulated-bank pattern where a capital-heavy asset is uneconomic to duplicate does not apply to a lease-by-lease drilling program whose inputs (rigs, crews, sand, acreage) are bid for in open markets against better-capitalised competitors [44].
Essentiality and operating history
Both of these run in Devon's favour. The product is essential: Devon describes producing "a valuable commodity that is fundamental to society" [45], and world oil demand is not a question this tab needs to adjudicate. The operating history is long: 55 years since founding, 38 as a public company [46], and the CEO frames that history as one of transacting: "Devon has a 55-year history of buying and selling assets" [47].
That framing carries a caution for anyone leaning on longevity as a durability proxy. The corporate entity is 55 years old; the asset base is not. Devon sold the Barnett Shale in 2020 [48], bought Grayson Mill's Williston business for $5.0 billion in 2024 [49], merged with Coterra in 2026 [50], and is now running a portfolio review aimed at concentrating on the Permian [51]. Continuity of the ticker is not continuity of the earning assets. The evidence assembled here — fragmented market, no pricing power, regulation as cost, capital as maintenance — is the raw material the Durability tab tests against the year-10 question, and the Damage Math trial weighs the temporary-versus-permanent read on the drawdown.
First-Pass Exclusion Screen
X1 — auto OEM: not applicable
Devon manufactures nothing and sells no vehicles. Note 20 describes a company "engaged primarily in the exploration, development and production of oil, natural gas and NGLs," with all US operating segments aggregated into one reporting segment [52]. The auto-OEM exclusion does not engage. Worth stating explicitly, because the shape of the trap the exclusion guards against — a cyclical, capital-heavy, undifferentiated business that screens cheap on FCF yield — is a shape this company shares even though the industry label does not match. That resemblance is a matter for Yield and Durability to test on the numbers, not a screen hit here.
X4 — consensus-saturated darling positioning: no
Three checks, all pointing the same way.
Multiple to sales and forward earnings. Devon trades at a forward P/E of 8.65, second-lowest in a seven-name group of US independents, and at roughly 3.3× trailing sales — mid-pack, and overstated because trailing revenue captures only about two months of Coterra.
Source: market data as of the 2026-07-31 close; price-to-sales computed as market capitalisation divided by trailing-twelve-month revenue. Peer set per the run's competition file. Not sourced to a filing page.
Chart shape. The bottom-left-to-top-right pattern is absent. At the 2026-07-29 close of $44.405, DVN trades below its year-end close in every year from 2005 through 2014, and far below the $124.36 closing peak of 2008. Over the last decade the stock closed as low as $5.41 in 2020 and as high as $78.04 in 2022. The recent path — a $47.03 peak on 2024-07-31, a $26.80 trough on 2025-04-08, a 43.0% drawdown, and $44.405 today — is quantified in the Dislocation tab.
Coverage tone. This is the one check where the reading is two-sided. Sell-side coverage as of mid-2026 is constructive, not divided: approximately 19 buy ratings against 4 holds and no sells, with a consensus target near $60 versus a $45 share price. That is a sell side that agrees the shares are cheap. It is not, however, the darling condition the exclusion describes — a story the whole consensus already owns at an extended multiple. The multiple is not extended and the chart has not compounded; a constructive sell side on a de-rated cyclical is a different fact pattern, and one the Yield tab's consensus check treats as evidence rather than exclusion.
S1 — China dependence: quantified at zero
Devon has no China revenue and no China assets. Exploration and production activities are "solely focused in the U.S." [53]; 100% of the $16,786 million of FY2025 revenue from contracts with customers arises from US onshore production and US marketing [54]; all 2,200 employees are in the US [55]. The word "China" appears in the FY2025 filing only inside forward-looking-statement boilerplate about tariffs and trade protection measures [56].
The honest qualification: Devon's product is priced in a global market where Chinese demand is one of the larger swing variables, so the realised price per barrel carries indirect China sensitivity even though the revenue and asset base carry none. That is a commodity-price exposure shared by every producer on earth, not the entity-level China dependence the flag is designed to catch.
X2 and X3
Promotional-CEO patterns and structural-decline evidence belong to Self-Help and Durability. Nothing encountered in the business record here forced an early flag on either. Two facts collected in passing and passed forward: the merger reconstituted the board at 11 members, six legacy Devon directors and five from Coterra, and made Thomas Jorden — Coterra's chairman, chief executive and president [57] — Devon's non-executive chair [58], while the CEO seat did not change hands: Clay Gaspar led Devon as president and chief executive before the close [59] and after it [60]; and revenue has risen in each of the last two fiscal years, 5.1% in FY2024 and 5.4% in FY2025, so the three-consecutive-year revenue-decline disqualifier is not met on reported figures (fit_features.revenue_trajectory.consecutive_decline_years = 0).
Dislocation
Devon fell 43.0% from a $47.03 close on 31 July 2024 to $26.80 on 8 April 2025 — a real drawdown with a dated trigger, four sessions of tariff-and-OPEC+ selling. That episode has since closed. The stock recovered 65.7% off the low, traded above the old peak in March 2026, and sits at $44.41, 5.6% under the peak. Traded volume never confirmed capitulation: the measured spike was 1.92x.
The drawdown, quantified
Peak — 31 Jul 2024
Trough — 8 Apr 2025
Current — 29 Jul 2026
Peak to Trough
Source: daily NYSE closing prices. Peak, trough, current and depth are the deterministic capitulation-gauge figures (peak $47.03 on 2024-07-31; trough $26.80 on 2025-04-08; current close $44.405 on 2026-07-29; depth −43.0%; 251 days peak-to-trough).
The fall took 251 days and arrived in three legs separated by two rallies, not one shock. On 634 million shares outstanding, the peak-to-trough move removed roughly $12.8 billion of equity value; what that figure should be measured against is the subject of Damage Math.
Source: daily NYSE closing prices, month-end closes; the 31 Jul 2024 peak ($47.03), 8 Apr 2025 trough ($26.80) and 27 Mar 2026 high ($52.07) are intramonth closes not shown by the month-end series.
Source: daily NYSE closing prices; leg endpoints are local closing extremes within the drawdown window.
Two qualifications on the current figure. The 29 July 2026 bar in the price feed carries 200 shares of volume against a $42.66 prior close, so it is an incomplete session print; the last full session, 28 July 2026, closed at $42.66 — 9.3% below the July 2024 peak rather than 5.6%. And the share count behind the deterministic feature file, 633 million, predates the Coterra merger that closed on 7 May 2026: Devon's own June 2026 deck sizes an $8 billion repurchase authorization at "15% of our market value" [1], implying a combined-company market value near $53 billion against the $28.1 billion the feature file carries. Per-share drawdown arithmetic is unaffected; anything divided by market cap is not, which matters in Yield.
The trigger
The event leg is four sessions, 3 to 8 April 2025, and Devon names the cause in its own filings. The Q1 2025 10-Q, covering the quarter that contained the crash, records that "during the first quarter of 2025, commodity prices have experienced heightened volatility and declines, driven primarily by economic uncertainty in global trade arising from geopolitical events and shifting trade policies, such as the imposition of tariffs by the U.S. and planned oil output increases by OPEC+" [2]. The FY2025 10-K repeats the attribution for the full year and adds the price move: WTI averaged $64.87 per barrel in 2025 against $75.79 in 2024, "an approximately 14% decline" [3].
The two dated external events sit on consecutive days. The US tariff schedule was announced after the close on 2 April 2025; on 3 April eight OPEC+ producers agreed to raise combined output by 411,000 barrels per day, roughly three times the increase the market expected for the following month. Devon's four sessions:
Source: daily NYSE closing prices and volume; multiples are against the 6.68 million-share median daily volume over the 180 calendar days before the 31 July 2024 peak — the same denominator the capitulation gauge uses.
Cumulatively the stock went from $37.92 on 2 April to $26.80 on 8 April, a 29.3% fall in four sessions on volume averaging 2.85x the pre-peak median. The reversal is as instructive as the fall: on 9 April, when the tariff schedule was paused for 90 days, Devon rose 15.9% in a single session — the largest up day in the entire window. Nothing Devon did caused either move.
The event leg versus the preceding slide. The first two legs took the stock from $47.03 to $30.52 between 31 July and 19 December 2024 — 35.1% — with no dated adverse company event attached. Devon reported Q2 2024 after the close on 6 August 2024, beating consensus EPS by 11.0%, and the stock rose 2.8% the next session; Q3 2024, reported after the close on 5 November 2024, came in 13.3% above consensus on revenue and in line on EPS, and the stock rose 1.7% the next session. The 9 December 2024 announcement that CEO Rick Muncrief would retire on 1 March 2025 was followed by a 1.5% gain. What fell over those five months was the crude price, carried into the equity. On the framework's own test — a fall with no dated event and no volume signature is a slide, not the moment — legs one and two are the slide and April 2025 is the moment.
The fear gauge
The measured spike is 1.92x: the highest 20-day average volume inside the peak-to-trough leg (12.79 million shares) divided by the median daily volume over the 180 calendar days before the peak (6.68 million shares). That is elevated, and it is a long way from capitulation.
Two features of where the spike sits matter more than its size. First, the 20-day window that produced the 1.92x maximum ended on 15 January 2025 — inside the December leg, roughly three months before the low. At the 8 April 2025 trough itself, the 20-day average had reached only 1.45x. Second, the single heaviest session of the whole fall, 20 December 2024 at 34.6 million shares or 5.19x the median, closed up 0.8%: that volume was mechanical, not selling pressure setting the price.
Source: daily NYSE traded volume; denominator is the 6.68 million-share median daily volume over the 180 calendar days before the 31 July 2024 peak.
The chart carries the finding. The heaviest sustained trading in this stock over the last thirty-one months was not the drawdown at all — it was March 2026 at 2.87x and May and June 2026 at 2.33x and 2.24x, the months around the Coterra merger vote and close. The fear months peaked at 1.82x (December 2024) and 1.71x (April 2025). April 2025 does show real intensity when read at daily resolution rather than on a 20-day average: 3.45x on 4 April, 2.65x on the trough day. The honest reading is that the smoothed gauge understates a four-session panic, and the panic was still not large by the standard of what this stock trades on merger news.
Who was selling
Short interest cannot be sourced from this run. Every field in the run's short-interest dataset returned zero rows — reported positions, borrow pressure, public net-short disclosures and peer context alike — so level and change are not measurable here. Publicly reported compilations of the semi-monthly FINRA reports put Devon's short interest at roughly 20.3 million shares (3.51% of float) in mid-December 2024, near 22.1 million shares (3.87%) in February 2025, back to roughly 16.4 million shares (2.88%) by late March 2025, and 16.65 million shares (2.95%, 2.01 days to cover) in December 2025. Those figures are third-party compilations with imprecise settlement dates, not primary data. On their face they describe a stock that was never crowded short and where the short base was shrinking before the April trough, not adding into it.
Insiders were absent from both sides. Across the 2,441 insider transactions in the corpus, exactly one open-market trade falls between 1 July 2024 and 31 July 2026: a 7,685-share sale at $33.46 on 11 August 2025. No Devon insider made an open-market purchase at any point during or after the 43% fall.
The two largest index holders did not sell. BlackRock reported 44,508,195 shares, 6.9% of the class, at 31 March 2025 — a week before the trough — and 49,513,335 shares, 7.9%, at 31 December 2025, an increase of five million shares. Vanguard reported 82,780,446 shares, 12.75%, at 31 March 2025; after its January 2026 internal realignment split the filing across two entities, the 31 March 2026 disclosures total 81,081,279 shares, 13.07% of a smaller class. Both positions rose as a share of the company through and after the fall.
The largest identified buyer was Devon. The company repurchased $1,057 million of stock in 2024 and $1,050 million in 2025, including $300 million in Q4 2024 and $301 million in Q1 2025 — the latter, on the CFO's account, "the upper end of our target buyback range for the quarter" [4]. Program-to-date, Devon has "repurchased approximately 100 million common shares for approximately $4.4 billion, or $44.02 per share" [5] — an average cost within a percent of today's price. What that says about the repurchase discipline belongs in Self-Help.
One structural supply event is on the record. The Grayson Mill Williston acquisition, closed 27 September 2024 for approximately $5.0 billion, was paid partly in "approximately 37.3 million shares of Devon common stock" [6] — about 5.9% of the share count, issued to a private seller in the middle of leg two. The filings disclose the issuance, not the disposition, so this is a supply fact rather than evidence of forced selling.
Nothing in this record identifies a forced or anchored seller of the kind the framework hunts. The visible holders held or added; the company bought; the shorts were small and shrinking. What sold was the marginal, unidentified holder of an oil-price proxy over four days.
Estimates versus price timing
The price fell substantially harder than the earnings, and it fell first.
Sources: share price from daily NYSE closes; core EPS from reported quarterly results; revenue and operating cash flow as reported; WTI averages from the FY2025 10-K [7].
Core EPS fell 19.0% between 2024 and 2025; the equity fell 43.0% peak to trough, 2.3 times as far. Operating cash flow did not fall at all — $6.7 billion in 2025 against $6.6 billion in 2024, which the 10-K attributes to "higher production volumes and lower taxes" offsetting lower oil prices [8].
The sequencing is the sharper point. Through the first 35% of the fall the company's own numbers were moving up, not down. Devon beat on Q3 2024 revenue by 13.3% and on Q4 2024 EPS by 15.7%. At the Q4 2024 call on 19 February 2025, with the stock 26% below its peak, management reported that "our board approved an increase to $0.24 per share… a 9% improvement over the 2024 rate" [9], and then raised 2025 guidance: "we're bumping our 2025 production and reducing our capital from the soft guide that we provided on the last call… We expect these improvements to drive more than $300 million in additional free cash flow this year" [10]. The stock rose 7.7% that day and then resumed falling.
The company's response to the April shock came after the shock, not before it: the business optimization plan targeting "$1.0 billion in annual pre-tax free cash flow improvements by the end of 2026" was announced in April 2025 [11], two weeks after the 8 April trough, and by the 6 May call had already been accelerated, with 2025 capital cut $100 million and the target framed as "deliver an additional $1 billion in annual free cash flow by year end 2026" [12]. The same call reported Q1 2025 operating cash flow of $1.9 billion, which "exceeded consensus estimates by a healthy margin" [13].
A limitation on the estimate side. The consensus revision feed available in this run holds only trailing-180-day snapshots taken from 30 January 2026 onward, so the analyst-estimate path across the 2024–25 fall cannot be measured directly; the comparison above uses reported results and company guidance instead. Where snapshots do exist, the 2026 pattern repeats: consensus FY2027 EPS was $5.478 on 29 June 2026 and $5.237 on 29 July 2026, a 4.4% cut, and FY2028 fell 2.1% over the same month — while the price had already fallen 22.7% from its 27 March 2026 high to its 1 July 2026 low. Snapshots from January and April 2026 are not comparable to these, because the Coterra merger re-based the estimate set (FY2027 consensus revenue moves from $15.8 billion to $26.6 billion across that boundary).
Where the price sits now
The 2024–25 dislocation has been repaired, and then some. From the $26.80 trough the stock returned 65.7% to $44.41, closed above the old $47.03 peak on 17 March 2026, and reached $52.07 on 27 March 2026 — 10.7% above the July 2024 high. It sits at the 61st percentile of its 52-week range of $31.74 to $52.57.
The decline since March 2026 is a commodity round trip rather than an adverse company event. Devon's Q1 2026 10-Q records that "during the first quarter of 2026, commodity prices have experienced heightened volatility, driven primarily by significant geopolitical events, including conflict in the Middle East and disruptions to global oil supply, along with continued uncertainty in global trade policy and OPEC+ production decisions," with WTI averaging roughly $72 in Q1 2026 against roughly $59 in Q4 2025, and a $0.6 billion non-cash derivative valuation loss reducing net earnings [14]. The stock rose with that spike and gave it back as it unwound: $52.07 on 27 March to $40.25 on 1 July, down 22.7%. The heaviest single session in the leg was 6 May 2026, down 8.6% on 39.8 million shares, the day after Q1 2026 results came in $0.05 below consensus EPS and 3.1% below on revenue — and the day before the Coterra merger closed. Against that, the company's June 2026 update reported a 33% dividend increase and the repurchase authorization upsized to $8 billion [15], with the current outlook "beating independent DVN + CTRA February original plans on production (+2%) with in-line capital" [16].
There is no live dislocation at $44.41. There was one — dated, triggered, and quantifiable — and it ended sixteen months ago. The stock trades 5.6% below its July 2024 peak, 65.7% above its April 2025 low, and within a percent of the $44.02 average price Devon itself has paid across 100 million shares of repurchases. The framework's entry condition asks for a stock that fear has repriced recently; the record shows a completed round trip instead, plus a second, shallower 22.7% commodity unwind since March 2026 that has already retraced 35% of its own decline. Whether what that leaves is cheap on adjusted cash flow is a separate question, answered in Yield, with the timing in Clock.
Damage Math
Between 31 July 2024 and 8 April 2025 Devon's equity lost $12.7 billion of value. The filed damage to earning power over the same period was a $1.3 billion pre-tax hit from realized prices — and capital guidance fell while production guidance rose. Discounted at 10%, that hit is worth $1.8 billion if temporary and $10.3 billion if permanent. The trial puts the probability it is temporary at 0.71.
The near-term hit, quantified
The framework's canonical setup is a company that cuts its own numbers and a market that capitalizes the cut. Devon did not cut. Across the eight months of the fall it raised production guidance twice and lowered capital guidance three times, and the free-cash-flow figure it published at a constant oil price went up, not down.
Sources: preliminary 2025 outlook and free-cash-flow sensitivities, Q3 2024 earnings deck [1]; improved 2025 outlook, Q4 2024 deck [2]; updated outlooks, Q1 2025 deck [3] and the August 2025 oil guide of 384 – 390 MBo/d on $3.6 – $3.8 billion of capital, Q2 2025 deck [4]; capital and free-cash-flow actuals from the FY2025 Form 10-K sources-and-uses table [5] and production actuals from the same filing's production-volumes table [6]. The November 2024 free-cash-flow figure is read off that deck's sensitivity chart, whose text states a 9% free-cash-flow yield at $70 WTI on the 1 November 2024 market capitalization; the February 2025 figure is the deck's stated floor of more than $3.0 billion. The August 2025 point interpolates between the deck's $65 WTI ($3.0 billion) and $75 WTI ($3.7 billion) bars.
Two of those moves came before the April 2025 crash. At the Q4 2024 call on 19 February 2025, with the stock already 26% below its peak, the CFO said Devon was "bumping our 2025 production and reducing our capital from the soft guide that we provided on the last call" and expected the changes "to drive more than $300 million in additional free cash flow this year" [7]. The third and fourth came after it: the business optimization plan announced in April 2025 targeted "$1.0 billion in annual pre-tax free cash flow improvements by the end of 2026" [8], and by the 6 May call the CEO framed it as delivering "an additional $1 billion in annual free cash flow by year end 2026" [9].
What did fall was the commodity. The trigger the company names in its own filing is external: "commodity prices have experienced heightened volatility and declines, driven primarily by economic uncertainty in global trade arising from geopolitical events and shifting trade policies, such as the imposition of tariffs by the U.S. and planned oil output increases by OPEC+" [10]. WTI averaged $64.87 per barrel in 2025 against $75.79 in 2024, "an approximately 14% decline" [11].
The 10-K puts a figure on that decline. "From 2024 to 2025, realized prices contributed to an approximately $1.3 billion decrease in earnings" [12]. The net-earnings bridge on page 59 itemizes it at −$1,335 million, against +$1,382 million from volumes, −$384 million from production expenses and −$594 million from depreciation, depletion, amortization and impairments; the eight components reconcile exactly to the stated 2024 and 2025 totals of $2,942 million and $2,681 million [13]. The $1,335 million pre-tax realized-price effect is the numerator of everything below.
Free cash flow itself never fell. Operating cash flow less capital expenditures ran $2,661 million in 2023, $2,955 million in 2024 and $3,119 million in 2025, on operating cash flow of $6,544 million, $6,600 million and $6,711 million against capital expenditures of $3,883 million, $3,645 million and $3,592 million [14] [15].
A limitation on the consensus record. The vendor revision feed for this run carries trailing-180-day estimate snapshots taken from 30 January 2026 onward, so the analyst path across the 2024–25 fall cannot be measured directly, and the snapshots that do exist straddle the Coterra merger, which re-based FY2027 consensus revenue from $15.8 billion to $26.6 billion. What the feed can settle is where FY2025 landed against the sell side: normalized EPS came in at $3.92 against a $3.949 mean, and revenue at $17,188 million against a $16,713 million mean — a 0.7% shortfall on earnings and a 2.8% beat on revenue, on the vendor's own definitions, data as of 29 July 2026. Against the eight quarters through Q1 2026 the record is four beats and four misses on normalized EPS, the largest being +15.7% for Q4 2024 and −4.2% for Q1 2026.
The price move over the same window
Sources: closing prices from the daily NYSE feed (peak $47.03, trough $26.80); period-average basic share counts from the Q2 2024 and Q1 2025 Forms 10-Q earnings-per-share notes; net debt is total debt less cash at 30 June 2024 and 31 March 2025 as reported. Market capitalization and enterprise value are derived from those figures.
Holding the share count constant at the 626 million outstanding when the stock peaked, the $20.23 per-share fall destroyed $12.66 billion of value for the holders who owned it at the top. Measured on each date's own share count the figure is $12.21 billion, a 41.5% decline.
Enterprise value fell less — $9.53 billion, or 27.7% — because Devon added $2.7 billion of net debt inside the window. That was not distress: on 27 September 2024 Devon "acquired the Williston Basin business of Grayson Mill for total consideration of approximately $5.0 billion, consisting of $3.5 billion of cash and approximately 37.3 million shares" [16], and the deal brought 247 MMBoe of purchased reserves with it [17]. The enterprise the market was marking down at the trough was materially larger than the one it had marked up at the peak, which makes the equity figure the cleaner measure of what happened to a shareholder and the enterprise figure the more conservative one for what happened to the business.
Set against the near-term hit: FY2025 normalized EPS landed 0.7% below the consensus mean, reported free cash flow rose 5.6%, and the market capitalization fell 41.5%.
The NPV arithmetic
The two-scenario calculation below is deliberately plain. Every input is stated; nothing is modeled that cannot be recomputed from the numbers on this page.
Source: derived. After-tax annual damage of $1,033 million is the $1,335 million realized-price line of the FY2025 net-earnings bridge [18] taxed at the FY2025 effective rate, discounted at 10%; price damage is 626 million shares times the $20.23 peak-to-trough per-share fall.
The workings, line by line:
- Temporary, two years. $1,033m × (1.10⁻¹ + 1.10⁻²) = $1,033m × 1.7355 = $1.79 billion.
- Temporary, three years. $1,033m × 2.4869 = $2.57 billion.
- Permanent, 15-year annuity. $1,033m × 7.6061 = $7.86 billion.
- Permanent, perpetuity. $1,033m ÷ 0.10 = $10.33 billion.
- Split. The permanent slice is the per-unit margin gap that survived at flat benchmark prices: total field-level cash margin was $27.78 per Boe in Q1 2026 against $30.16 a year earlier [19], a $2.38 gap on 75.0 MMBoe of quarterly production, or $714 million a year pre-tax and $552 million after tax. Capitalized in perpetuity that is $5.52 billion; the residual $481 million of the annual hit, treated as temporary over two years, adds $0.83 billion. Total $6.36 billion.
- Probability-weighted. At the trial's ruling of 0.71: (0.71 × $1.79bn) + (0.29 × $10.33bn) = $4.27 billion.
The gap. Against $12.66 billion of price damage, the probability-weighted NPV damage of $4.27 billion leaves $8.39 billion, or 66% of the fall, unexplained by the arithmetic of the problem itself. Against the harshest single reading — the whole hit permanent, capitalized in perpetuity — the gap narrows to $2.33 billion, 18%. On an enterprise-value basis the gap against the probability-weighted case is $5.26 billion; against the permanent-perpetuity case, enterprise value fell $9.53 billion versus $10.33 billion of damage, so on that pairing there is no gap at all. Which framing a reader prefers turns on whether the debt Devon raised to buy Grayson Mill belongs in the numerator, and the answer is that it bought 247 MMBoe of reserves, so it does not.
The company's own filed NPV, as a cross-check
Devon publishes a 10%-discounted net present value of its proved reserves every year. It fell from $19,770 million at year-end 2024 to $18,765 million at year-end 2025 — $1.0 billion, or 5.1% — while future cash inflows fell only 1.5% and the 10% discount deduction barely moved [20].
Sources: standardized measure from the FY2025 Form 10-K supplemental oil and gas disclosures [21]; proved reserves from the same note [22]. Per-Boe figures are derived.
The headline 5.1% understates the like-for-like move, because the reserve base grew 13% over the same year on 443 MMBoe of extensions and discoveries and 43 MMBoe of purchases [23]. Per barrel of proved reserves the standardized measure fell from $9.17 to $7.73, 15.8%. Applying the 2025 per-Boe figure to the 2024 reserve base gives $16.66 billion against $19.77 billion actual — a like-for-like NPV decline of $3.1 billion. Both readings — $1.0 billion headline, $3.1 billion like-for-like — sit inside the range the two-scenario calculation produces, and both sit far below $12.66 billion.
One qualification the filing states plainly: the 16 MMBoe of negative reserve revisions in 2025 were "primarily due to price decreases in the trailing 12-month average for oil and NGLs partially offset by price increases in the trailing 12-month average for gas" [24]. The standardized measure is computed at a trailing price deck; it registers the same price move the equity registered, on the same assets, and it moved a fifth as far.
Temporary or permanent: the trial, and its ruling
The temporary-versus-permanent question was argued by two independent briefs writing from the same corpus, each seeing only its own side, and ruled on by three judges reading in randomized order.
The case for temporary, at its strongest
Cash earning power never fell. Operating cash flow rose in each of the three years through the drawdown — $6,544 million, $6,600 million, $6,711 million — with management stating Devon "generated $6.7 billion of operating cash flow in 2025, demonstrating resilience despite lower oil prices" [25]. The reserve base grew rather than shrank: 1,817 to 2,155 to 2,428 MMBoe, on 443 MMBoe of extensions and 150 MMBoe of positive non-price revisions against 307 MMBoe produced, with proved undeveloped reserves up 33% [26] [27]. The cost base came down and stayed down — the $1.0 billion optimization plan reached roughly 85% through 2025 [28] and by Q1 2026 was "on track to achieve the full $1.0 billion target ahead of our original year-end 2026 timeline" [29]. And the funding breakeven was never approached: Devon's Q2 2025 deck put it under $45 WTI including the dividend [30], against a 2025 WTI average of $64.87 [31].
The case for permanent, at its strongest
Per-unit cash margin eroded in a way the oil price does not explain. Total field-level cash margin fell from $32.76 per Boe in 2023 to $29.63 in 2024 [32] to $24.97 in 2025 [33] — a 23.8% fall against a 16.4% fall in WTI over the same two years, the index having averaged $77.62 in 2023 [34]. Product mix does not explain it: oil was 47.1% of Boe production in 2024 and 46.3% in 2025, gas 27.0% and 27.4% [35]. Every core asset participated: Delaware $34.38 to $25.74, Rockies $32.19 to $23.20, Eagle Ford $41.71 to $35.96. The gap survived into a quarter when benchmark prices rose: Q1 2026 field margin was $27.78 per Boe against $30.16 a year earlier, even though WTI rose 1% and Henry Hub rose 38% [36]. Against FY2022, diluted EPS fell from $9.12 to $4.17 [37] while dividends paid fell from $3,379 million to $619 million [38] [39], debt outstanding rose from $6.4 billion at the end of 2022 [40] to $8.4 billion at the end of 2025 [41], and the forward case now depends on Coterra synergies ramping through 2027 rather than on the standalone asset. Management's own inventory language separates "the front five years versus the back five years", with "much more confidence in that front five years" [42].
The ruling
Source: the profile's adversarial trial record — three blind judges, randomized reading order, ruling as recorded in the run's trial tally. Not a filing figure.
The judges put the probability that Devon's impairment is temporary at 0.71, on a range of 0.68 to 0.78 and a mean of 0.723. The spread is 0.10 and the ruling is not contested. Reading order moved almost nothing: seats that read the temporary brief first averaged 0.71, seats that read the permanent brief first averaged 0.73, a gap of 0.02.
The reasoning converged on the same two facts from opposite directions. The judge who read temporary first called the standardized measure holding at −2.8% over two years on a 34% larger reserve base the decisive evidence for temporary, and the field-margin erosion at flat benchmark prices the decisive evidence for permanent — and weighted the second heavily enough to cap the probability at 0.71. The judge who scored highest, at 0.78, reached it the same way and named the same cap, adding that the permanent brief's EPS exhibit measures from a $95-WTI peak, and that from FY2024 earnings fell 9%, not by half.
The trial also disqualified evidence on both sides. Two temporary exhibits were discounted: the "$1 billion, 100% complete" scorecard is guidance-based and assumes a $1.0 billion term loan is retired after the merger closes, against roughly 85% and $850 million actually achieved through 2025 [43] [44]; and the under-$45 breakeven footnote includes the benefit of a hedge portfolio that rolls off, which the brief omitted [45]. Two permanent exhibits were discounted in turn: the 45 MMBoe of proved undeveloped reserves removed for changed development plans nets against 32 MMBoe of upward revisions to −13 MMBoe, with total proved undeveloped reserves rising 33% [46]; and the "front five years" inventory quote sits inside an affirmatively bullish answer about a ten-year outlook across all five basins, so using it as an indictment inverts the speaker [47].
The ruling is the diagnosis this report carries. Nothing in the analysis above or below overrides it.
Which line broke, and whether it self-corrects
Oil is not the line that broke. Devon realized 97% of the WTI index on unhedged oil in FY2025 and 97% again in Q1 2026 [48] [49]. What broke is the residual barrel — Permian gas and NGLs.
Sources: FY2024 and FY2025 oil realized price, unhedged, from the FY2025 Form 10-K [50] and gas and NGL realizations from the gas and NGL price tables in the same filing [51]; quarterly realizations from the Q1 2026 Form 10-Q [52]. Unhedged realizations as reported; ratios are derived from the same tables.
The Q1 2026 quarter isolates the mechanism. WTI rose 1% and Henry Hub rose 38%, and realized prices still "contributed to a $175 million decrease in earnings … primarily due to lower unhedged realized gas and NGL prices", partially offset by higher oil [53]. Devon's gas fetched $1.66 per Mcf against a $5.05 Henry Hub, and its NGLs $17.80 per barrel against a $72.10 WTI. Annualized, that is the $714 million pre-tax residual carried into the split scenario above — the permanent slice the judges weighted against the temporary case.
Whether it self-corrects is a basis question, and the driver-level consensus underwrites correction rather than assumes it.
Source: driver-level consensus from the run's analyst-model dataset, snapshot dated 29 July 2026. Henry Hub and company realized gas are carried by 14 to 22 contributing brokers; the Delaware Basin line by 4 to 7. Not a filing figure.
Consensus has Devon's realized gas price rising from $1.65 per Mcf in FY2026 to $2.57 in FY2027 against a Henry Hub deck that is flat to slightly lower — a realization ratio moving from 45% to 72%. The Delaware Basin line is starker still: $1.05 in FY2026 to $2.51 in FY2027. That is basis normalization as Permian takeaway is added, expressed as an estimate rather than a fact, and it carries only four to five contributing brokers in the out years.
Three qualifications belong with it. FY2027 and FY2028 are pro forma for Coterra, whose Marcellus gas realizes closer to Henry Hub, so part of the company-level recovery is mix rather than basis repair — and the Delaware line is not insulated either, since the merger deck describes the combination as creating "one of the largest operators in the Delaware Basin" with 746,000 pro forma acres [54]. NGL realizations are not modeled to recover at all — consensus has them at $20.09, $19.70 and $19.72 per barrel across FY2026 to FY2028. And Devon's own Q1 2026 deck claims the Delaware NGL differential "improved ~$2/Bbl from Q1 2025" [55] while the company-wide realization in the 10-Q fell from $22.03 to $17.80 over exactly that period against a roughly flat Mont Belvieu index [56]. A basin-level differential and a company-level realization can both be reported honestly and still point in opposite directions, but the reader is entitled to see that they do.
The cost side of the same driver set moves the other way, and with more contributors: lease operating expense of $9.04 per Boe in FY2025 falling to $8.25, $7.84 and $7.78 across FY2026 to FY2028, and general and administrative expense of $1.57 per Boe falling to $1.04. Devon has named the specific commercial actions behind part of that — $200 million of annual savings from signed Delaware contracts, and a capital baseline cut from $3.9 billion to $3.6 billion [57] — and layered a targeted $1.0 billion of run-rate pre-tax Coterra synergies on top by year-end 2027, split roughly $350 million capital, $350 million operating margin and $280 million corporate on the deck's 2027 exit-rate bar [58]. More than 90% of the 2026 combined capital program is oil-weighted [59], which is to say the stream that broke is the one Devon is spending least to grow.
Where the gap stands now
The gap this tab measures was real and it was large: at $26.80 on 8 April 2025, the price carried $12.66 billion of damage against $4.27 billion of probability-weighted NPV damage, and it did so on a company that had just raised production guidance and cut capital guidance.
It is also closed. At $44.41 the stock sits $2.62 below its July 2024 peak; on the 626 million shares outstanding at that peak, the remaining price damage is $1.64 billion — below even the two-year temporary scenario's $1.79 billion, and far below the $4.27 billion the ruling implies. Devon itself has repurchased roughly 100 million shares at an average $44.02, within a percent of today's price [60], and within weeks of closing Coterra raised the dividend 33% and upsized the repurchase authorization to "$8bn, representing 15% of our market value" [61]. On the framework's own arithmetic, the mispricing that existed at the trough does not exist at this price. The drawdown anatomy is in Dislocation; what the current price implies about adjusted cash yield is in Yield; the buyback mechanics are in Self-Help.
Two things would change this read. If FY2026 and FY2027 field-level cash margin fails to recover toward the 2024 level of $29.63 per Boe with WTI near $70 — that is, if the Q1 2026 gap of $2.38 per Boe persists — the permanent slice is larger than $714 million a year and the split scenario understates the damage. If year-end 2026 proved reserves fall on non-price revisions, or the standardized measure drops materially at a flat SEC price deck, the price mechanics reading converts into genuine asset impairment and the whole calculation moves toward the permanent pole.
Bottom line
Devon's FY2025 adjusted free cash flow computes to $1,661 million — reported FCF of $3,119 million, less $99 million of share-based compensation, less a $1,359 million five-year average acquisition charge [1]. On the pre-merger share base that is a 5.9% yield, and the three-year average is 6.2%. On the post-Coterra company, consensus FY2027 adjusted FCF lands near 11% of a $51.2 billion market cap — at the 10% reference line the balance sheet selects, not comfortably above it.
The deterministic feature file computes this tab's market cap as $28.1 billion — 633 million shares (the FY2025 count) at the July 29, 2026 close of $44.405. Devon completed an all-stock merger with Coterra on May 7, 2026 and had 1,153,403,107 shares outstanding on May 18, 2026. Every yield in this tab is therefore computed twice: on the pre-merger base where the cash flow is Devon standalone, and on the post-merger base of $51.2 billion where the cash flow is the combined company.
The adjustment, line by line
fit_features.adjusted_fcf returns not_computable for Devon — the structured cash-flow feed carries only two years with a free-cash-flow field and no share-based compensation before FY2018, so the derivation never finds a complete five-year acquisition window. The table below rebuilds the same formula directly from the filed Consolidated Statements of Cash Flows in the FY2021, FY2023 and FY2025 Form 10-Ks, which together cover 2019 through 2025 [2][3][4].
Figures in $ millions. Adjusted FCF = operating cash flow − capital expenditures − share-based compensation − trailing five-fiscal-year average of "Acquisitions of property and equipment"; derived from the filed cash-flow statements in the FY2021 [5], FY2023 [6] and FY2025 [7] Form 10-Ks. The five-year average column is blank for 2019–2022 because the corpus holds no 10-K covering 2017–2018 acquisitions.
Two things the adjustment removes. Share compensation is small and steady — $88 million to $115 million a year across all seven years, $99 million in FY2025, or 3.2% of that year's reported FCF and 1.5% of operating cash flow [8]. The acquisition charge is the whole of the adjustment. Devon spent $6,795 million of cash on acquisitions across 2021–2025 — $2,583 million in 2022 and $3,808 million for Grayson Mill in 2024 against $18 million, $64 million and $322 million in the other three years [9][10]. Averaged, that is a $1,359 million annual charge — 44% of FY2025 reported FCF. The reported yield overstates the owner's yield by that much because the cash Devon calls free has, at this company's demonstrated rate, gone into buying reserves rather than to shareholders.
Devon's own FY2025 free-cash-flow headline of $3.1 billion [11] ties to the $3,119 million computed here — an 11.1% yield on the same $28,108 million base — so the disagreement between the framework's number and the company's number is entirely the adjustment, not a definitional dispute about capex.
The cash-acquisition line also understates how much of Devon's growth has been bought rather than drilled, because the three largest transactions of the period were paid in stock: WPX in 2021, part of Grayson Mill in 2024 [12], and Coterra in 2026, where each Coterra share converted into 0.70 of a Devon share [13]. Share count went from 377 million at the end of 2020 to 633 million at the end of 2025 to 1,153,403,107 in May 2026 [14]. A rising share count is an outright exclusion under the framework, and it is treated at length in Self-Help; it is named here because per-share adjusted FCF, not aggregate adjusted FCF, is what a yield means.
The yield, three ways
Partial = (reported FCF − share-based comp) ÷ fiscal-year-end market cap. Full = partial less the trailing five-year average acquisition charge, computable only from FY2023. Market cap uses same-year period-end share count and the last close on or before December 31; derived from the filed cash-flow statements [15] and company filings, as reported.
Current, on the pre-merger base. FY2025 adjusted FCF of $1,661 million against the feature file's $28,108 million market cap (633 million shares at $44.405, July 29, 2026) computes to 5.9% — $2.62 of adjusted FCF per pre-merger share against a $44.405 price.
Three-year average. Adjusted FCF averaged $1,749 million across FY2023–FY2025 ($2,027M, $1,560M, $1,661M). On the same $28,108 million market cap that is 6.2%.
The baseline. fit_features.yield_baseline returns not_computable for the same reason the adjusted series does. Rebuilt, the three computable years sit at 7.0%, 7.5% and 7.2% — a median of 7.2% and a coefficient of variation of 11.5%, which is a genuinely stable baseline over the window it covers. The current 5.9% is below that baseline, not above it: the stock has recovered from $26.80 on April 8, 2025 to $44.405 while adjusted FCF has moved sideways. The wider seven-year partial-adjustment series (0.2%, 3.7%, 9.6%, 14.7%, 8.8%, 13.8%, 13.0%) has no stable level at all — it is the commodity cycle, not a baseline.
There is no jump signature here. The fortress pattern the framework hunts — a name that sat at 3.5–4% for years and suddenly prints 8–9% — requires both a stable prior level and a step up from it. Devon's stable level is roughly 7%, and today's reading on the pre-merger base is 1.3 percentage points beneath it.
Which bar applies
fit_features.balance_sheet_class returns unknown because EBITDA is missing for FY2025 in the structured feed. The computation from the filed statements:
- Net debt = short-term debt $998M + long-term debt $7,391M [16] − cash and cash equivalents $1,384M [17] = $7,005M
- EBITDA = earnings before income taxes $3,466M + financing costs, net $455M + depreciation, depletion and amortization $3,595M = $7,516M [18]
- Net debt / EBITDA = 7,005 ÷ 7,516 = 0.93x. Vendor consensus records FY2025 EBITDA of $7,413M, which gives 0.95x — the same answer.
The framework's rule places fortress at net cash or 0.5x and below, and levered at 3.0x and above. At 0.93x Devon is squarely moderate, so the 10% reference line applies, not the 8–9% fortress line and not the 25% levered line.
Devon labels the same balance sheet "Fortress" in its own decks [19] while disclosing 0.9x adjusted pro forma net-debt-to-EBITDAX on the same slide deck family [20]. Both statements describe the same number; the framework's arithmetic and the company's adjective simply set different thresholds. Forward, the gap narrows: consensus carries net debt to $9,005M against $12,546M of FY2026 EBITDA (0.72x) and to $5,593M against $14,828M in FY2027 (0.38x), against a stated company target of gross debt near $9 billion by year-end 2027 and leverage held under 1.0x through the cycle [21]. If the FY2027 consensus balance sheet arrives, the class flips to fortress and the applicable line drops to 8–9%. That is a forward observation, not the basis on which this tab measures.
Where the name sits. 5.9% on FY2025 adjusted FCF against the 10% bar — 410 basis points short. On the three-year average, 6.2% against 10% — 380 basis points short. Both computed on Devon standalone against the pre-merger equity base. The forward figures below are what change this picture.
Normalized mid-cycle yield
Devon is meaningfully cyclical — this is an oil and gas producer whose cash margin is a direct function of two index prices — so the current-year number needs a mid-cycle check rather than a sentence of dismissal.
Source: WTI and Henry Hub index prices as disclosed in Devon's own realized-price tables — FY2021 Form 10-K [22], FY2023 Form 10-K [23], FY2025 Form 10-K [24].
The mid-cycle assumption, stated so it can be recomputed. The window is FY2020–FY2025, the six fiscal years Devon's own filings disclose an annual index price for. It contains one collapse (2020, WTI $39.59) and one spike (2022, WTI $94.39), which is what makes it usable as a cycle rather than a trend. The arithmetic mean is WTI $70.02 and Henry Hub $3.50. A reader who prefers to drop the two extremes gets WTI $71.54 and Henry Hub $3.07 on the remaining four years — oil essentially unchanged, gas 12% lower.
Against that mid-cycle, FY2025 was modestly below, not depressed: WTI averaged $64.87, about 7% under the six-year mean, and Henry Hub $3.43, roughly at it [25]. The current environment is at or above mid-cycle on oil and well above it on gas: Q1 2026 printed WTI $72.10 and Henry Hub $5.05 [26].
Volume and cost assumption. Volumes and cost structure are held at the company's published full-year 2026 guidance for the combined company — oil 490–510 MBbls/d, NGLs 315–330 MBbls/d, gas 3,300–3,400 MMcf/d, total capital $4,800–5,000 million, with oil realized at 98–100% of WTI, NGLs at 24–26% of WTI and gas at 40–50% of Henry Hub [27]. Only price is flexed.
The two sensitivities. For oil, Devon published its own: standalone, Q2 2026 annualized free cash flow of roughly $4.8 billion at $90 WTI rising to $6.5 billion at $110 WTI [28] — $85 million of FCF per $1/Bbl on approximately 392 MBbls/d of oil. Scaled to the combined company's 500 MBbls/d guidance midpoint, that is $108 million of FCF per $1/Bbl of WTI. For gas, no company sensitivity is published; computed from the guidance inputs, 3,350 MMcf/d is 1,223 Bcf a year, at a 45% Henry Hub realization, net of 7% production and property taxes and a 20% current cash tax rate, giving $409 million of FCF per $1.00/Mcf of Henry Hub.
What the normalization shows. Consensus FY2027 EBITDA of $14,828 million against pro forma production of 1,604 MBoe/d — the 1Q26 combined figure Devon publishes [29] — is $25.33 per Boe of unit cash margin. Strip out the $1.0 billion synergy target [30] and it is $23.62 per Boe. Devon standalone earned $24.51 per Boe in FY2025: $7,516 million of earnings before income taxes, financing costs and DD&A [31] over 840 MBoe/d of production, at WTI $64.87 and Henry Hub $3.43 [32]. So the forward consensus embeds a per-barrel cash margin, before synergies, about 4% below what Devon actually earned in a year priced at $65 oil. That is a mid-cycle forecast, not a peak-price one — the forward yields below do not need to be discounted for an inflated commodity deck. The counter-fact: consensus is thin at the annual level (7 to 8 contributors on revenue, 17 on EBITDA) and 1Q26's actual $5.05 Henry Hub is 44% above the six-year mean, so a gas mean-reversion of $1.50/Mcf would remove roughly $614 million of combined FCF on the sensitivity above.
The consensus check
fit_features.consensus_forward_yield reads FY2026 22.4%, FY2027 26.4%, FY2028 26.6% and FY2029 28.0%. Those are consensus free cash flow for the combined company divided by the pre-merger $28.1 billion market cap, and they overstate by a factor of 1.82. The consensus series is combined-company on its face: quarterly consensus revenue steps from $3,946 million for Q1 2026 (Devon standalone, actual $3,807 million) to $6,189 million for Q2 2026 and $6,874 million for Q3 2026, which is when Coterra enters. The correct denominator is 1,153,403,107 shares at $44.405 = $51,217 million [33]. Devon corroborates the scale independently: its $8 billion repurchase authorization is described as "representing 15% of our market value," which implies roughly $53 billion [6].
Consensus free cash flow means from the vendor estimates file, vintage July 30, 2026 (data/sp/estimates.json). Feature-file yield divides by $28,108M; corrected yield divides by $51,217M — 1,153,403,107 shares [34] at the July 29, 2026 close of $44.405.
The framework's yield basis is adjusted FCF, and the vendor metric is plain free cash flow — cash from operations less capital expenditures, the closest available proxy, with no direct adjusted-FCF consensus published. Applying the two adjustments to FY2027, the first clean full year with Coterra:
All four rows start from consensus FY2027 free cash flow of $7,417M and deduct $200M of assumed combined share-based compensation (Devon standalone ran $99M [35]; Coterra's figure is not in this corpus). The revenue-scaled charge takes Devon's five-year average acquisition spend as 8.1% of FY2025 revenue and applies that rate to consensus FY2027 revenue of $26,622M.
The bar requires $5,122 million — 10% of $51,217 million. On Devon's own demonstrated acquisition rate the forward figure clears it by $736 million; on a charge scaled to the larger asset base it misses by $61 million. The honest statement is that consensus forward adjusted FCF lands at the 10% line, within the width of the assumption about future acquisition spend, in a range of 8.8% to 14.1% and a central estimate near 11%.
Does the sell side already agree? On unadjusted free cash flow, yes and by a wide margin — 14.5% for FY2027 rising to 15.4% by FY2029, well clear of any of the framework's three lines. That is the configuration the framework treats as the strong version of the setup: consensus itself underwrites the cash, so the disagreement would have to be about fear rather than fundamentals. The problem for the setup is on the other side of the equation. Devon is not trading at a fear price. The stock is $44.405 against a $47.03 peak on July 31, 2024 — down 5.6%, having recovered from the $26.80 trough of April 8, 2025. The 43% drawdown the framework looks for happened and has already been repriced; the anatomy of it is in Dislocation.
The forward path. No mean-reversion underwrite is required here, because consensus is not below the bar. What has to hold instead is durability. Using the sensitivities above and the Devon-trailing acquisition charge, the $736 million cushion above the bar is equivalent to $6.79/Bbl of WTI or $1.80/Mcf of Henry Hub. Consensus is built on a per-Boe cash margin already 4% below Devon's FY2025 realization, so the cushion is not a peak-price artifact — but under the revenue-scaled acquisition charge there is no cushion at all, and any further stock-funded acquisition resets the per-share arithmetic the way Coterra just did. Weighing those: roughly a 55–65% probability that adjusted FCF yield sits at or above 10% on a one-to-three-year view, with the outcome turning far more on how much cash and stock the combined company spends on acquisitions than on the commodity deck. What would move that estimate: a board-set capital-allocation framework that caps acquisition spend, or a first full combined year in which acquisition spend runs at the low end.
FCF to revenue
Revenue is revenue from contracts with customers as disclosed in the FY2025 Form 10-K [36]; cash flows from the filed statements [37][38][39].
Reported conversion is stable, and stable in the direction that matters. FCF/revenue held at 17.6%, 18.6% and 18.6% across FY2023–FY2025 while the WTI index Devon realizes against fell from $77.62 to $75.79 to $64.87 [40][41]. Flat conversion into a 16% fall in the oil price is improving conversion — the arithmetic of the $1.0 billion business-optimization programme, 85% captured on the Q4 2025 exit rate [42], showing up in cash rather than in a slide.
Adjusted conversion tells a different story: 13.4%, 9.8%, 9.9%. The step down between FY2023 and FY2024 is the Grayson Mill purchase entering the five-year average, not an operating deterioration. It is a fair reading that the adjusted series is the honest one for an acquirer and the reported series is the honest one for the underlying assets, and the two only converge if acquisition spend falls.
On consistency of cash generation, the record is better than the yield level. Reported FCF has been positive every year of the last decade the corpus covers, including $311 million in 2020 at WTI $39.59 with a $2.7 billion net loss [43]. The rolling five-year average has risen through the last three windows — $2,401 million, $2,965 million, $3,527 million — with a coefficient of variation of 15.5%; the three computable adjusted-FCF years vary by 11.5%. Volatile year to year, but not unpredictable, which is the distinction the framework draws.
What this tab establishes
Devon has a 55-year operating history, positive free cash flow in every year the corpus covers, and organic reserve replacement averaging 140% since 2019. It also has no market structure, no entry barrier, no pricing power, and 7.9 years of proved reserves. Management's own inventory visibility runs about ten years — the gate's exact horizon. On the year-10 test the evidence does not reach very high conviction.
The conviction sources, graded for Devon
Ruchir's year-10 conviction comes from five specific places. Three of them do not apply to Devon at all, and saying so is the point of the exercise.
Market structure — does not apply. Devon is a price-taker in a fragmented industry. Its own risk factors put it plainly: "Strong competition exists in all sectors of the oil and gas industry," and "certain of our competitors have resources substantially greater than ours and may have established superior strategic long-term positions" [1]. In its largest asset, the Delaware Basin, Devon's own investor deck ranks it fifth of the twenty-one operators charted by gross operated inventory locations, with roughly 2,600 against a leading bar that runs off the top of the 4,000 axis [2]. That is the opposite of the monopoly/duopoly/oligopoly structure the framework wants. Post-merger the position improves but the structure does not: on Devon's own pro-forma slide, 2026 estimated production is led by ConocoPhillips at roughly 2,350 MBOED, with the combined Devon second at more than 1,600 MBOED and Occidental, EOG, Expand and EQT clustered between 1,100 and 1,450 behind it [3].
Source: August 2025 Investor Presentation, Delaware Basin inventory by key operator, sourced by Devon to Enverus Permian Basin Reports dated 14 April 2025. The slide labels only Devon's bar, so peer names are placeholders and every location count is read off the chart; the leading bar is broken above the 4,000 axis maximum, making 4,000 a floor rather than its value [4].
Regulatory entry barriers — do not apply. Regulation here raises cost; it does not restrict entry. Devon's own description is of a compliance burden — permits, surety bonds, methane rules, plugging obligations — with the observation that it does "not expect such compliance costs or impacts to affect our operations materially differently than other similarly situated companies" [5]. No regulator allocates Permian acreage or limits the number of operators. Approximately 15% of Devon's 2.4 million net acres sit on federal land [6] — a federal-permitting exposure, which is a risk rather than a protection.
Capital intensity — real, but not a moat. Property and equipment net of depletion is $25.4 billion of a $31.6 billion balance sheet, and capital expenditure ran $3,592 million in 2025 [7], [8] — "approximately 54% of our operating cash flow" [9]. The framework's version of capital intensity is a replacement-cost barrier: an asset base a competitor cannot rebuild. Shale acreage is not that. It is bought and sold continuously, and Devon has been on both sides — buying WPX in 2021, Grayson Mill in 2024, and Coterra in 2026, while dissolving its Eagle Ford Blackhawk partnership with BPX Energy in an acreage exchange [10] and monetising the Matterhorn pipeline stake for $409 million [11]. Capital here is a requirement to stay in place, not a wall around the business.
Essentialness — applies, and the 2020 record proves it. Through the sharpest demand shock in modern history, Devon's volumes rose: 119 MMBoe in 2019 to 122 MMBoe in 2020 [12]. What collapsed was price: realised oil fell to $35.95 per barrel in 2020 from $54.73 in 2019 [13]. The product kept selling; the price did the damage. Customer concentration is negligible — no customer exceeded 10% of sales revenue in 2024 or 2025, and Devon states it could access alternative purchasers if any major customer stopped buying [14]. That is the honest reading of essentialness for a commodity producer: demand for the molecule is durable, the price of the molecule is not.
Operating history — applies. "Founded in 1971 and publicly held since 1988" [15]; 2025 marked "its 54th anniversary in the oil and gas business and its 37th year as a public company" [16]. Regular quarterly dividends have been paid since the second quarter of 1993 [17]. Devon has survived 1998, 2008–09, 2015–16 and 2020. This is the conviction source that genuinely holds — with the caveat that survival is not the test; higher revenue and higher cash flow in year 10 is.
Reserve life is the durability arithmetic
Devon's own risk factor states the mechanism better than any outside analysis could: "our estimated proved reserves and future oil, gas and NGL production will decline materially as reserves are produced unless we conduct successful exploration and development activities… our current development activity is focused on unconventional oil and gas assets, which generally have significantly higher decline rates as compared to conventional assets" [18].
The arithmetic: proved reserves at 31 December 2025 were 2,428 MMBoe [19] against 2025 production of 307 MMBoe [20] — a reserve-to-production ratio of 7.9 years. That ratio has sat between 6.2 and 8.1 years for the whole visible history.
Sources: proved reserve rollforwards, FY2021 10-K [21], FY2023 10-K [22] and FY2025 10-K [23]; production from the FY2021 [24], FY2022 [25] and FY2025 [26] 10-Ks. Ratio derived from those figures.
Everything Devon sells in year 10 must be found, converted from resource, or bought between now and then. The record on that is genuinely good. Organic additions — extensions and discoveries plus all revisions, excluding purchases and sales — have covered production in five of the last seven years and averaged 140% of production across the whole period.
Source: derived from the proved reserve rollforwards and production tables in the FY2021 [27], FY2023 [28] and FY2025 [29] 10-Ks. Purchases and sales of reserves excluded.
The counterweight sits in the same tables. Devon's reserve base grew from 823 MMBoe at end-2018 to 2,428 MMBoe at end-2025 [30], [31]. Purchased reserves over that span totalled 1,119 MMBoe — 663 MMBoe from WPX in 2021, 153 MMBoe in 2022, 247 MMBoe from Grayson Mill in 2024, 43 MMBoe in 2025 and 13 MMBoe across 2019 and 2020 — against 107 MMBoe sold. Roughly 63% of the increase in the reserve base was bought. The largest of those purchases, WPX, was an all-stock merger of equals [32]; Grayson Mill was bought with $3.5 billion of cash and 37.3 million Devon shares [33]. Scale grew; the moat did not.
The threats, hunted and sized
The inventory clock is the threat that lands on the gate's own horizon. Devon's stated inventory duration is about ten years. Asked directly in the third-quarter 2024 call how deep the backlog runs, then-COO Clay Gaspar answered: "We feel very confident in a 10-year runway in all five of our basins… as you think about the front five years versus the back five years, we have much more confidence in that front five years… That just gives us five years to continue to innovate and get more efficient on that back five" [34]. The 2023 deck put the same point in numbers: more than 4,500 risked locations, about 12 years at then-current pace, at $65 WTI and $3.25 Henry Hub; the 20-year figure requires unrisked inventory with appraisal and tighter spacing [35]. The February 2026 merger deck claims more than "10 years of highly competitive inventory at current pace of development" for the combined Delaware position [36].
The company's own disclosure therefore says its economically competitive drilling inventory runs out at roughly the point the gate is asking about, with management's confidence explicitly concentrated in the first half of that window. Outside work is harsher: Goehring and Rozencwajg's Permian analysis (June 2023) estimated that the basin had already developed nearly 60% of its Tier-1 acreage, that publicly traded operators averaged 3.7 years of Tier-1 locations, and that the Eagle Ford and Bakken crossed that same threshold in 2018 "right before production stopped growing." Treat that as a dated third-party estimate rather than a filed fact — but it is directionally consistent with Devon's own front-five/back-five framing, and Devon has not published a location count that contradicts it.
Price is the larger threat, and it is unhedgeable over a decade. Devon's risk factors record that over the last five years, monthly NYMEX WTI ranged from over $120 per barrel to under $50, and Henry Hub from over $9.50 per MMBtu to under $1.60 [37]. Roughly 30% of 2026 volumes are hedged [38]; nothing hedges year 10. Holding 2025 volumes constant and applying 2020's realised prices to them gives the size of the exposure:
Source: derived — 2025 volumes of 142 MMBbls oil, 505 Bcf gas and 81 MMBbls NGL from the FY2025 10-K [39], priced at 2025 realisations ($62.77/Bbl, $1.67/Mcf, $18.28/Bbl) and at 2020 realisations ($35.95/Bbl, $1.48/Mcf, $11.72/Bbl) from the FY2021 10-K [40]. The $11,237M total reconciles to reported oil, gas and NGL sales of $11,223M [41] within rounding on whole-number volumes.
At 2020's realised prices and unchanged volumes, upstream sales fall 39%, from $11.2 billion to $6.8 billion. That is not a stress scenario invented for the page — it is a price level Devon actually realised six years ago. To hold year-10 revenue above today's at that price deck, volumes would have to rise about 65%.
Substitution and demand. The EIA's Annual Energy Outlook 2026, published 8 April 2026, projects US crude oil production of 12.4 to 12.7 million barrels per day by 2050 against 13.6 million in 2025 — "relatively stable, decreasing slightly" — citing "only modestly increasing Brent crude oil prices over the long term and dwindling prime drilling acreage." The same outlook has US natural gas production growing from 107 Bcf/d in 2025 to between 133 and 151 Bcf/d by 2050, strongest in the Appalachian Basin. That mix matters: post-merger, Marcellus supplies over 45% of pro-forma gas volumes and 20% of total production [42], [43]. On the national data, the substitution threat to the product over ten years is modest — flat oil, growing gas. Devon's own risk disclosure is more pointed about the second-order channel: initiatives "subsidizing or otherwise encouraging the development and adoption of alternative energy sources" may "reduce the competitiveness of carbon-based fuels," financial institutions restricting capital to the sector "could decrease the value of our business," and the combination could result in "uneconomic or 'stranded' assets" [44].
Produced water disposal — a specific, named, escalating constraint on the Delaware Basin. Devon discloses that New Mexico now requires operators to limit injection rates near seismic events, and that "the Railroad Commission of Texas has… suspend[ed] all disposal well permits that inject into deep strata within the Northern Culberson-Reeves area due to increasing seismicity concerns," which "could limit the takeaway capacity for produced water in the impacted area, which could increase our operating expenses, require us to curtail our development plans or otherwise adversely impact our operations" [45]. Culberson and Reeves are named counties in Devon's Delaware footprint [46], and the Delaware carries 53% of pro-forma 2026 production [47]. Industry data through 2026 puts basin-wide produced water at over 20 million barrels a day and rising toward 26 million by 2030, with more than 4,000 magnitude-3.0-plus events recorded and roughly 20 deep injection wells shut in within the North Culberson-Reeves response area. This is a cost-and-permitting constraint rather than a demand threat, and Devon has not quantified a volume impact; the honest sizing is that it raises the marginal cost of Delaware development and can gate the pace, not that it ends it.
Execution is not a moat. Devon's stated advantages — a 2025 field-level cash margin of $24.97 per Boe [48], a $1.0 billion business optimisation programme [49], and $1.0 billion of merger synergies [50] — are cost outcomes competitors can and do pursue on the same rock with the same service contractors. They improve the odds of surviving a low-price decade; they do not protect year-10 revenue.
The disqualifier check
The framework's structural-decline disqualifier asks whether revenue has fallen high-single-digit for three consecutive fiscal years. fit_features.revenue_trajectory reports consecutive_decline_years: 0 and three_year_hsd_decline: false.
Source: fit_features.revenue_trajectory, matching total revenues from contracts with customers of $16,786M for 2025, $15,919M for 2024 and $15,140M for 2023 as reported in the FY2025 10-K [51].
The longest decline run in the series is two years — 2019 at −20.9% and 2020 at −30.0%, a divestiture-and-pandemic sequence that reversed at +194% in 2021. The single 2023 decline of −23.6% was a price year, not a volume year: production rose from 223 to 240 MMBoe while Devon's realised oil price fell from $94.11 to $75.98 per barrel [52], [53]. The flag does not fire, and nothing in the pattern of declines looks structural. What the chart does show is the amplitude the framework's disqualifier is not designed to catch: a business whose reported revenue can move ±30% in a year without anything changing about the asset.
The series begins at FY2016 because that is where the deterministic feature file begins; the corpus holds annual reports back to FY2021 only, so a longer revenue history cannot be sourced to a filed page in this run.
FCF consistency (P2)
fit_features.fcf_stability returns an empty rolling_5y_avg array. The stated reason: "fewer than five consecutive adjusted-FCF years," which in turn traces to adjusted_fcf being uncomputable — "missing SBC for FY 2016, 2017; no complete consecutive five-year acquisition window with SBC." The framework's adjusted-FCF stability series therefore does not exist for Devon in this run, and no substitute for it is invented here. The adjusted-yield computation belongs to Yield.
What the filed cash-flow statements do support is a reported free-cash-flow series — operating cash flow less capital expenditures — for FY2019 through FY2025.
Source: consolidated statements of cash flows — FY2021 10-K for 2019–2021 [54], FY2022 10-K for 2022 [55], FY2025 10-K for 2023–2025 [56]. Free cash flow and the rolling average are derived as operating cash flow less capital expenditures; this is reported FCF, not the framework's adjusted measure.
Three findings, and they cut in different directions.
Single-year FCF is extremely volatile: $133 million in 2019 against $5,988 million in 2022 — a 45-fold range within four years. The framework tolerates that explicitly; volatile is fine, unpredictable is not.
The rolling five-year average has been stable and rising: $2,401M, $2,965M, $3,527M across the three available windows — a coefficient of variation of about 16%. That is the shape P2 asks for. The qualification is that only three overlapping windows exist and all three contain the 2022 peak, so the average is not yet independent evidence; it is one commodity cycle observed three times.
There are no negative FCF years in the visible record — not even 2020, when free cash flow was $311 million despite a $2,693 million asset impairment and a $2,671 million net loss [57]. The framework's tolerated 5-to-8-year negative episode — the insurance and banking underwriting cycle, where bad years are the reason good-year margins exist — has no analogue here. Devon's mechanism is different: capital expenditure is discretionary and cut alongside cash flow, which is why FCF stays positive rather than swinging negative. Capex fell to $1,153 million in 2020 from $1,910 million in 2019 [58]. That is a genuine structural defence of the cash flow line — and it is bought by underinvesting in the reserve base exactly when reserves are hardest to replace, which is why organic replacement fell to 85% and 92% in 2019 and 2020.
The year-10 case, both ways
The strongest case that year-10 revenue and adjusted FCF are higher. Production has compounded from 119 MMBoe in 2019 to 307 MMBoe in 2025 [59], [60], and the combined company guides to 1.355–1.405 MMBoe per day for 2026 — roughly 504 MMBoe annualised at the midpoint, about 64% above 2025 [61]. Organic reserve replacement has averaged 140% of production over seven years and reached 188% in 2025. Reported FCF has been positive in every visible year, including 2020, and the rolling five-year average has risen in each available window. The EIA's April 2026 long-term outlook has US gas production growing roughly 25–40% by 2050 and oil essentially flat, and Devon post-merger takes over 45% of its gas from the Marcellus [62]. Consensus free-cash-flow estimates in the feature file run from $6.28 billion for FY2026 to $7.87 billion for FY2029 — double 2025's reported $3.1 billion, on a company that is now roughly twice the size. Devon is 55 years old and has been through four industry collapses.
The strongest case against. Revenue is price multiplied by volume, and Devon controls neither. It is fifth of twenty in its own core basin [63], sells at "variable, or market-sensitive, prices" for the vast majority of production [64], and has watched its own realised oil price move from $35.95 in 2020 to $94.11 in 2022 to $62.77 in 2025 [65], [66], [67]. At 2020's realised deck and today's volumes, upstream sales are 39% lower. The asset depletes at 7.9 years of proved reserves, and management puts its economically competitive inventory at more than ten years — an assertion whose confidence management itself splits into a derisked front five and a back five that depends on innovation not yet performed [68]. Roughly 63% of the reserve growth since 2018 was purchased, most of it with shares, so the volume record that supports the bull case is partly an acquisition record — and a durability case that depends on continuing to buy reserves at unknown future prices is not a moat. None of the framework's five conviction sources except essentialness and operating history apply, and both of those establish that Devon will exist in year 10, not that it will be larger.
The read. The gate is not met: there is a genuine doubt, and it is that year-10 revenue and adjusted free cash flow are set by a commodity price no one can underwrite over a decade, on a reserve base with 7.9 years of proved life and roughly ten years of company-identified competitive inventory. The counter-evidence is real and is not dismissed — 140% average organic replacement, seven straight positive-FCF years including 2020, a rising rolling five-year average, and a pro-forma production base 64% above 2025 all argue that volumes can grow enough to carry revenue through a weaker price deck. What would change this read is evidence that the volume path is independent of the price path: a decade of inventory demonstrated at a sub-$50 WTI break-even rather than at $65, organic replacement holding above 100% through a low-price stretch rather than the 85% and 92% recorded in 2019 and 2020, and a rolling five-year FCF average that stays stable across a second, independent cycle rather than three overlapping windows around one peak. On today's record the standard the framework sets — very high conviction — is not reached.
Where This Lands
Devon can outlast a long stretch of weak prices: leverage under 1x, a 24.8% debt-to-capitalization ratio against a 65% covenant, and no maturity year above $1.25 billion through 2030. The repurchase engine is real — $4.4 billion and 99.8 million shares retired since 2021. It has not shrunk the company. Period-end shares went from 382 million at the end of 2020 to 1,153 million in May 2026, on three equity-funded mergers.
Debt and Maturities
Devon's last audited balance sheet carried $8,389 million of total debt [1] against $1,384 million of cash [2], and the Q1 2026 10-Q showed the position essentially unchanged at $8,386 million on 31 March 2026 [3]. Net debt of $7,005 million against FY2025 EBITDAX of $7,413 million is 0.95x [4]. Management put the merged company at 0.9x adjusted pro forma net debt to EBITDAX with $4.4 billion of liquidity [5]. By the deterministic rule the profile applies (levered at 3.0x or above, fortress at 0.5x or below), that is a moderate balance sheet, and the 10% adjusted-yield reference line rather than the 25% levered line is the one that applies. The fit_features file could not classify it — EBITDA was missing for FY2025 — so the classification here is taken from the filed EBITDAX reconciliation.
The maturity schedule is the whole answer on duration. Devon's own footnote is the left column; the legacy Coterra notes that became Devon obligations in the June 2026 exchange are the right one.
Sources: FY2025 Form 10-K debt footnote, maturities as of December 31 2025 [6]; legacy Coterra note principal from the June 25 2026 exchange settlement [7].
Sources: FY2025 Form 10-K, Note 13 maturity table [8]; legacy Coterra series totals summed from the exchange settlement table [9]. The Coterra column is this tab's arithmetic: tendered plus untendered principal for each series, before any 2026 repayments.
The 2026 figure is a single instrument — the $1.0 billion Term Loan drawn in September 2024 to part-fund Grayson Mill, due 25 September 2026 [10]. Nothing else falls due in size until 2027, when $463 million of Devon notes and roughly $750 million of legacy Coterra 3.90% notes mature together. Against that, the company holds $3.0 billion of undrawn revolver and no commercial paper outstanding [11], with the facility maturity extended in the first quarter of 2026 from March 2030 to March 2031 [12], and exited 2025 with $4.4 billion of liquidity [13].
One financial covenant binds: total funded debt to total capitalization no greater than 65%. Devon was at 24.8% at year-end 2025 and 24.9% at the end of Q1 2026 [14][15]. Refinancing risk is small in both size and cost: $7.4 billion of the standalone stack is fixed-rate paper averaging 5.7%, and the floating Term Loan was at 5.2% in March 2026 [16]. Ratings are investment grade with positive outlooks at all three agencies — BBB at S&P, BBB+ at Fitch, Baa2 at Moody's [17].
The allocation question is separate from the survival question, and here the answer is explicit rather than inferred. The June 2026 framework targets up to 70% of cash to shareholders and roughly 30% to the balance sheet, with $1.25 billion of debt to be retired over the rest of 2026 and gross debt targeted at about $9 billion by year-end 2027 [18]. Consensus models the same shape: net debt falling from $9.0 billion in FY2026 to $1.7 billion in FY2028, absorbing roughly $7.3 billion of the $21.2 billion of free cash flow the street expects across those three years. Debt paydown is not forced on Devon by covenant or maturity pressure — it is a chosen co-priority, running alongside repurchases rather than displacing them.
The Repurchase Record
Cash actually spent, from the cash-flow statements:
Sources: FY2021 Form 10-K, Consolidated Statements of Cash Flows, repurchases of common stock for 2019–2021 [19]; FY2025 Form 10-K, Consolidated Statements of Cash Flows for 2023–2025 [20]. The FY2022 figure of $718 million comes from the FY2023 Form 10-K comparative series [21].
Devon also spent $2,956 million on repurchases in 2018, per the reported financials; that year predates the annual reports held in this corpus, so it carries no page anchor. The 2019 and 2020 figures make the cyclical point on their own — $1,849 million spent in 2019, then $38 million in 2020 as the oil price collapsed [22]. Repurchases here are a function of the commodity, not a constant.
The current program dates from 2 November 2021, when a $1.0 billion authorization was announced; it has since been expanded to $5.0 billion [23][24]. Through 2025 it had retired 99.8 million shares for $4,393 million at an average of $44.02 [25]. At $44.405 on 29 July 2026, the whole five-year program was executed at essentially today's price.
Sources: spend, share count and average price paid from the FY2025 Form 10-K, Note 17 [26]. Average close is this tab's calculation from the daily price series; the 2021 figure covers 2 November to 31 December 2021, the program's first window.
In every year since the program began, the average price paid sits within about a dollar of the average close for the period — and in 2025 the two match to the cent at $34.07. That is a calendar-paced program, spending a steady $250 million or so a quarter, rather than one that leans into weakness. It is a defensible policy and it did keep buying through the April 2025 low of $26.80 (see Dislocation), but it is not the behavior of a buyer waiting for maximum fear.
The share count is where the framework's test bites.
Sources: weighted-average diluted series from fit_features.share_count_trend, derived from reported financials. Period-end balances from the Consolidated Statements of Equity in the FY2021 [27], FY2023 [28] and FY2025 [29] Form 10-Ks; the 2026 bar is the 1,153,403,107 shares outstanding on the 18 May 2026 record date [30].
fit_features.share_count_trend records the count as rising, with a five-year CAGR of 10.9%. The period-end series shows why, and shows it larger: 382 million shares at the end of 2020, 663 million after the all-stock WPX merger closed in January 2021, 651 million at the end of 2024 after 37.3 million shares were issued for Grayson Mill [31], 622 million at the end of 2025, and 1,153 million after the all-stock Coterra merger [32]. Over five and a half years the count is up 202%.
This meets the framework's hard-fail condition. The system excludes companies whose share count keeps rising through serial acquisition, and Devon's has risen 202% in five and a half years — not through stock compensation, which runs at $99 million a year against $3,119 million of free cash flow [33], but through three equity-funded mergers in five years. The counter-fact deserves equal weight: between deals the buyback works, retiring 99.8 million shares and cutting the count 6.2% from 663 million to 622 million across 2021–2025 [34][35]. The mergers brought assets and cash flow with the shares, so per-share dilution is not the same as share-count growth. The framework tests the count, and the count fails.
The cash acquisition line tells the same story without the equity. Cash spent on "acquisitions of property and equipment" ran $18 million in 2021, $2,583 million in 2022, $64 million in 2023 [36], $3,808 million in 2024 and $322 million in 2025 [37] — a five-year average of $1,359 million, against FY2025 reported free cash flow of $3,119 million. Then, thirteen days after the Coterra merger closed, Devon paid approximately $2.6 billion for 16,300 net undeveloped Delaware Basin acres at a Bureau of Land Management lease sale, about $161,500 per acre [38]. That single purchase absorbed roughly two years of the company's own stated base repurchase run-rate.
Management's Stated Intent
The Q1 2026 call, on 6 May 2026, was the last before the merger closed, and the brokers asked about repurchases three separate ways. Clay Gaspar's prepared remarks set the frame: "both companies paused their share repurchase programs between deal announcement and close, building cash during a period of unexpectedly strong commodity price. With the repurchase program immediately resuming post close, we were positioned to increase repurchases activity beyond our legacy level, and capitalize on any discount to our intrinsic and relative value" [39].
Asked directly how the cash would be split, he declined to pre-commit: "we think about dividend policy, we think about share repurchases, and we think about debt repayment, how do we optimize those… different quarters can present different opportunities that we want to be nimble around… structurally, what we have talked about pre-close is enhancing that dividend. Likely to announce a very significant share repurchase program that we could move aggressively on. And then also, of course, we look at the debt" [40]. On whether the pause would be made up, he was explicit that it would not be mechanical: "I wouldn't presume that we're trying to make up for lost time on any specific numbers… there's a real excitement from both sides of the legacy teams that we have a real opportunity to return shareholder value with a tremendous amount of free cash flow and then leveraging the opportunity to buy back material shares" [41].
Five weeks later the numbers arrived. The CEO's mid-year note: "Within weeks of closing, we increased our dividend 33% and upsized our share repurchase program to $8bn, representing 15% of our market value" [42]. The framework page underneath it is the number that matters for a flywheel: an annual repurchase base of $1.0 billion to $1.5 billion, "sustainable through the commodity cycle," plus opportunistic upside [43].
Market Cap ($M)
Authorization / Mkt Cap
Base Buyback Yield
Dividend Yield
Source: derived from 1,153,403,107 shares outstanding at 18 May 2026 [44] at the 29 July 2026 close of $44.405, against the $8 billion authorization, the $1.0–1.5 billion annual base and the $0.32 quarterly dividend [45]. Base buyback yield shown at the $1.25 billion midpoint.
The arithmetic: 1,153.4 million shares at $44.405 is a $51.2 billion market capitalization. The $8 billion authorization is 15.6% of it, which reconciles with management's own "15% of our market value." But an authorization is a ceiling, not a spend. The committed base of $1.0–1.5 billion a year is 2.0% to 2.9% of market cap — and adding the $1.28 annual dividend brings total committed shareholder yield to roughly 5% to 6%. A 10% adjusted yield producing a 10% annual EPS uplift from repurchases alone is not what this policy describes. The gap between the two is the opportunistic tranche, which management has stated it will size against "any discount to our intrinsic and relative value" [46] — a genuine option, but an undated and unquantified one.
No insider has bought Devon stock on the open market since 4 March 2024, when then-CEO Rick Muncrief acquired 15,000 shares at $44.42. No open-market purchase was filed during the April 2025 trough at $26.80. Since the merger closed, three insiders have sold: CFO Jeffrey Ritenour, 70,029 shares at $46.66 on 11 May 2026; Adam Vela, 24,342 at $47.21; and Andrea Alexander, 18,000 at $46.74. The pattern is grants and disposals, not accumulation.
Source: Devon Form 4 filings, latest through 30 July 2026; no open-market purchase has been filed since 4 March 2024.
The Levered Exception
The framework tolerates debt only when the adjusted yield is very high — roughly 25% and above — and then only if all three legs compute. They do not here, and the exception is not reached in any case because the balance sheet is moderate rather than levered.
Sources: share counts as cited above [47][48]; free cash flow margins derived from operating cash flow less capital expenditures [49] over total revenues excluding derivative gains [50]; consensus free cash flow from the numeric estimates feed.
One of three legs computes. Two of three would not be the exception; one is not close to it.
Float Retirement Arithmetic
fit_features.float_retirement_years is not_computable — the derivation needs a positive adjusted free cash flow figure and the file could not build one, because stock-based compensation is missing for FY2016 and FY2017 and there is no complete consecutive five-year acquisition window paired with it. The absurdity check therefore cannot be stated on the framework's own basis, and no substitute figure is offered as if it were.
What can be stated, on reported and consensus figures and labelled as such: $51.2 billion of market capitalization against the $7,417 million of free cash flow consensus carries for FY2027 is 6.9 years to retire the entire float. Against the $6,282 million consensus for FY2026, 8.2 years. Against the policy that will actually run — a $1.0–1.5 billion annual base repurchase [51] — 34 to 51 years. The framework's reference point for a price that cannot survive is roughly three years. The distance from three to 6.9, and from 6.9 to 34, is the distance between what the cash flow could do and what the disclosed policy will do.
A caution on the inputs, which matters beyond this section. fit_features.market_cap carries $28.1 billion, computed from 633 million shares — the FY2025 weighted-average diluted count, which predates the Coterra merger by two quarters. The true count is 1,153,403,107 [52]. The consensus forward yields the file reports — 22.4% for FY2026 and 26.4% for FY2027 — are combined-company cash flows divided by a standalone market cap. Corrected to the merged share count, they are 12.3% and 14.5%. The yield still clears the 10% moderate-balance-sheet reference line; it is nowhere near the 25% levered line. The full treatment belongs to Yield; the correction is recorded here because the levered-exception and float-retirement tests both run off it.
Dividend Cover
The dividend is not the case. At $0.32 a quarter, or $1.28 a year [53], the yield on the 29 July close is 2.9% — below the roughly 4% line at which a dividend becomes a material part of the return. Cover is ample: about $1,476 million of annual cost against consensus free cash flow of $6,282 million for FY2026 and $7,417 million for FY2027, or 4.3x and 5.0x, and consistent with the company's stated target of paying 10% to 15% of cash flow through the dividend [54].
The record through a downturn is clean at the fixed layer and not at the variable one. Devon paid $140 million of dividends in 2019 and $257 million in 2020 [55], the year it lost $2,680 million [56]. The fixed dividend has been raised repeatedly since, from $0.22 to $0.24 in Q1 2025 [57] and to $0.32 after the merger [58]. The variable layer did get cut, and hard: total dividends paid fell from $1,858 million in 2023 to $937 million in 2024 to $619 million in 2025 as the variable component was eliminated [59]. What would force a cut in the fixed dividend now is a commodity move severe enough to take cash flow below roughly $10 billion, since the company caps the dividend at 10–15% of it; nothing in the maturity schedule or the covenant would compel one.
Promise Versus Delivery
Five material commitments from calls two to four years old, checked against what happened.
Sources, by row: Q2 2024 transcript [60] and the Q3 2025 progress statement [61] against the FY2025 and Q1 2026 debt notes [62][63]; Q1 2023 transcript [64] against the Q3 2024 transcript [65] and the FY2025 dividend note [66]; Q3 2024 transcript [67] against the FY2025 cash-flow statement [68]; Q1 2025 transcript [69] against the Q1 2026 transcript [70]; Q3 2025 transcript [71] against the $69 million of repurchases in the Q1 2026 cash-flow statement [72].
The operational record is met or beaten. Capital came in below guidance, the $1 billion optimization target landed early, and the 2025 production guide was raised through the year [73]. The two commitments that moved are both capital-return promises, and both moved in the same direction — away from a formula and toward discretion. The variable dividend, described in May 2023 as a "consistent formulaic approach" [74] that would pay "as much as 50% of our excess cash flow" [75], was retired eighteen months later: "it makes more sense to eliminate the variable for the near term and really lean in even further on the share repurchases" [76]. The $2.5 billion debt-reduction program announced in August 2024 [77] has retired under $500 million of gross debt on the balance sheet through March 2026, and the number has quietly dropped out of the script. Both were disclosed at the time, with reasons given, and both are defensible responses to a lower oil price. Neither was buried.
That distinction matters for the exclusion test. A promotional pattern means big claims, repeated misses, and low ownership. Devon shows the first only in the mild form of a stated intention revised in public, no operational misses in the sample, and real ownership. All named executive officers held stock in excess of the guidelines at 31 December 2025 — six times base salary for the CEO, three times for other named officers [78]. CEO Clay Gaspar beneficially owned 941,724 shares at 18 May 2026, about $41.8 million at the current price; Chairman Thomas Jorden owned 2,408,753, about $107 million; directors and executive officers as a group held 5,284,433 shares [79]. That group holding is 0.46% of the 1,153 million shares outstanding — meaningful money to the individuals, immaterial as a block. The promotional-CEO exclusion does not attach on this evidence.
The buyback pause is the item that most deserves the skeptic's attention, and it cuts the other way. Devon disclosed the suspension in the FY2025 10-K, before it became visible in the numbers: repurchase activity "has been suspended and is expected to remain suspended through the completion of the Merger" [80], and it flagged the intended post-close dividend of $0.315 and an authorization above $5 billion in the same filing [81]. The delivered authorization was $8 billion and the dividend $0.32 — both above what was pre-announced [82].
What would change this read: a first post-merger quarter — reported 4 August 2026 [83] — that shows repurchases running materially above the $1.5 billion annual top end while gross debt still tracks toward the $9 billion target would demonstrate that the flywheel and the balance sheet can run at full speed together. A quarter that shows the $2.6 billion lease purchase repeated, or the buyback held at the base while cash accumulates, would confirm that acquisition remains the first call on capital.
What this tab establishes
Devon's re-rating path runs on company-specific self-help, not an industry repricing cycle: $1.0 billion of merger synergies targeted at a year-end-2027 run-rate [1], an $8 billion repurchase authorization against roughly $51 billion of market value [2], and the first full combined quarter printing in November 2026. Devon's own record sets the bar: 15 drawdowns of 35% or deeper since 1990, median round trip 29 months, two never recovered.
The re-rating mechanism
Devon closed an all-stock merger with Coterra Energy on 7 May 2026; each Coterra share converted into 0.70 Devon shares, and Devon survived as the registrant [3]. The mechanisms that could close the gap between today's $44.41 and the street's $59.38 all originate in that transaction and the capital-allocation reset that followed it. Four of them carry dates; one does not.
Synergy capture, on a published schedule. The February 2026 announcement set $1.0 billion of pre-tax synergies at a run-rate by 2027 [4]. The June mid-year update converted that into a dated build: roughly $200 million of run-rate at the 2026 exit, roughly $600 million averaged across 2027, and roughly $980 million at the 2027 exit, split across capital optimization, operating margin and corporate cost [5]. Management restated the target as capturing $600 million during 2027 and reaching the $1.0 billion run-rate by year-end 2027 [6]. Evidence it is in motion: on the Q1 2026 call the integration teams had already identified 156 discrete value-capture items before close, and the CEO described the $1.0 billion as a floor [7]. The prior cycle is the reference: the stand-alone $1.0 billion business-optimization plan announced in April 2025 targeted $1.0 billion of annual pre-tax free cash flow improvement by the end of 2026 [8], and the May 2026 deck marks it 100% complete on stand-alone Q2 2026 guidance, ahead of that deadline [9]. Window: the checkpoints are the Q4 2026 print (2026 exit rate) and the Q4 2027 print (run-rate).
The buyback, shrinking the denominator. Within weeks of close Devon raised the dividend 33% and upsized the repurchase authorization to $8 billion, which it described as 15% of market value [10]. The authorization is a ceiling, not a pace: the same deck sets the annual base at $1.0–$1.5 billion, sustainable through the commodity cycle, with opportunistic upside on top [11]. On 1,153,403,107 shares outstanding at the 18 May 2026 record date [12] and the 29 July close of $44.405, market value is $51.2 billion. That is 1.8 times the $28.1 billion in the run's deterministic feature file, which multiplies the same close by the pre-merger FY2025 share count of 633 million; every ratio scaled by market value on this tab uses the $51.2 billion figure. The base pace retires 2.0%–2.9% of the float a year; the full $8 billion would retire 15.6%. Both numbers matter, and they are two years apart.
Deleveraging and portfolio rationalization. Devon targets retiring $1.25 billion of debt across the remainder of 2026 and roughly $9 billion of gross debt by year-end 2027, holding leverage below 1.0x through the cycle [13]. A complete review of all assets against strategic and financial criteria began at close [14], and the June update says only that Devon will provide updates "at the appropriate time" [15]. No calendar is attached to that review, and the framework's own falsifier applies to it directly: proceeds routed to debt paydown ahead of repurchases would blunt the flywheel described in Self-Help.
What is absent. There is no premium-repricing cycle here, no contract renewal calendar, no regulated rate reset. An exploration-and-production company's revenue reprices continuously with WTI, Henry Hub and NGL differentials, so mean reversion has no scheduled date. Management said as much on the Q1 call: the back end of the curve, not the front, is what they steer by, and they declined to call how the current supply disruption resolves [16]. The Centene-style setup — an industry-wide forecasting error that a repricing round mechanically corrects — is not the setup on this name. That is a difference in kind, not degree.
The dated calendar
Sources: Q2 2026 earnings date from Devon's 1 July 2026 scheduling release [17]; synergy and debt targets from the June 2026 mid-year update [18] [19]. Q3 2026 and Q4 2026 report dates are indicative, projected from Devon's 2025 reporting cadence, and are not company-confirmed; the portfolio-review row carries a placeholder date because no window has been published.
The nearest catalyst is two days out. Devon reports second-quarter 2026 results after the close on Tuesday 4 August 2026, with the call on 5 August [20]. That quarter is a stub: guidance for it reflects legacy Devon plus Coterra only from 7 May [21], so roughly 55 of 91 days are combined. It will also carry a $2.6 billion cash outflow: Devon paid approximately $161,500 per net acre for 16,300 net undeveloped Delaware Basin acres in the 20 May Bureau of Land Management lease sale, funded from cash on hand [22].
Base rates from Devon's own history
The run's daily price file covers 9,211 sessions from 2 January 1990 to 29 July 2026. Running a 30%-reversal zigzag across it isolates 15 completed peak-to-trough legs of 35% or deeper before the current episode began, plus the episode still in progress.
Source: derived from the run's daily close series (9,211 sessions, 1990–2026), data/prices/daily.json; 30%-reversal zigzag, closing prices only, dividends not reinvested. Bars with no upper segment did not regain the prior peak. The 2022-06 episode is the current one and has not recovered.
Source: derived from the run's daily close series, data/prices/daily.json; closing prices only, dividends not reinvested.
The base rates, across the 15 completed episodes:
- Depth. Median −47.2%; range −36.1% to −80.8%. A 40%-plus decline is Devon's normal amplitude, not an outlier.
- Time down. Median 4.9 months from peak to trough; only one episode (1997–98) took longer than seven months.
- Time back. Of the 15, 13 eventually regained the prior peak. Median round trip 29.3 months; median 22.3 months measured from the trough alone. Four of 13 round-tripped inside 18 months (5.9, 7.1, 9.4 and 12.7 months), one more inside 24 months.
- Failures. Two never recovered. The May 2008 peak of $124.36 has not been regained in 18 years; the March 2011 peak of $93.10 has not been regained in 15 years.
The current episode is unusual on one axis and ordinary on the other. Depth: from the 7 June 2022 close of $78.04 to the 8 April 2025 close of $26.80 is −65.7%, deeper than every completed episode except the 2020 collapse. Duration: 34.0 months from peak to trough, against a 4.9-month median — this was a three-year grind, not a crash. As of 29 July 2026 the stock is 15.7 months past that trough, up 65.7% from it, and still 43.1% below the 2022 peak; regaining that peak requires a further 75.7%.
Two qualifications belong here. First, the series is closing prices with no dividends added back, and Devon's payout over this window was large — $3,379 million in FY2022, $1,858 million in FY2023 and $937 million in FY2024, roughly $10 a share across the three years on the then-outstanding count. A total-return drawdown is materially shallower than −65.7%. Second, the deterministic feature file measures the current drawdown from a 31 July 2024 peak of $47.03 rather than the 2022 cycle high, giving −43.0% to the same April 2025 trough; that is the same trough on a shorter lookback window, and both figures are stated here rather than reconciled away. The drawdown anatomy itself belongs to Dislocation.
The 18-month read
Re-recognition to the street's own mark inside 18–24 months is a reasonable expectation; a round trip to the 2022 peak is not underwritable on this name's base rates. The evidence for the first half: every published mechanism lands inside the window — the 2026 synergy exit rate at December 2026, the $1.0 billion run-rate at December 2027, $1.25 billion of debt retired by December 2026, and a repurchase base of $1.0–$1.5 billion a year running continuously from close [23] [24]. Consensus already carries the arithmetic: FY2027 free cash flow of $7.42 billion against a $51.2 billion market value is a 14.5% yield — not the 26.4% the feature file reports on its pre-merger share count — and the mean target of $59.38 sits 33.7% above the 29 July close. The evidence against the second half: the 2022 peak was set at post-invasion oil and gas prices, four of 13 recovered episodes made it back inside 18 months, and two of 15 never made it back at all.
What would falsify the read is the mechanism failing to fire, and it has three named tests, each tied to the falsifier ledger: the 2026 synergy exit rate printing materially below roughly $200 million at the Q4 2026 report; repurchases running under the $1.0 billion annual base; or portfolio-review proceeds and free cash flow routed to debt paydown ahead of buybacks. A fourth sits outside management's control — a commodity path that undoes the cash flows underneath all of it.
What consensus expects, and when
Close, 29 Jul 2026
Consensus target (mean)
Lowest target
Highest target
Source: consensus estimate data as of 29 July 2026 (26 contributing targets); last close from the run's daily price series.
The sell side has not capitulated. Across 27 in-consensus opinions there are 21 buy and 4 outperform ratings against 2 hold, no sell and no underperform, for a consensus recommendation score of 1.30 on a scale where 1 is the most positive. The lowest published target, $44, is essentially the current price — no contributor carries a target implying material downside. The framework's entry condition is peak fear, and the analyst body is not expressing it. That cuts against fit on this criterion regardless of what the price has done.
Estimate momentum complicates the picture in both directions. FY2027 revenue consensus moved from $15.78 billion 180 days ago to $26.62 billion now as the merger entered the numbers, and FY2027 EPS from $4.71 to $5.24. But the near-term direction turned down in the last month: FY2027 revenue stood at $28.91 billion 30 days ago and EPS at $5.48, so the past 30 days took 7.9% off revenue and 4.4% off EPS. Guidance is not resetting against a low bar; estimates are being trimmed off a recent high, ahead of a print.
Source: consensus quarterly estimates as of 29 July 2026; figures for 3Q24 through 1Q26 are the consensus means standing before each print, not reported actuals.
Consensus expects the recovery to show up in printed numbers on a specific schedule. Quarterly free cash flow runs $521–$911 million through the stand-alone period, steps to $1,585 million in 2Q26, and reaches $1,935 million by 4Q26 and $2,178 million by 1Q27. EBITDA roughly doubles at the same seam, from $1,942 million in 1Q26 to $3,378 million in 2Q26.
The candidate quarter is the third of 2026, reported in early November. Second-quarter 2026, printing 4 August, is a stub with under two months of Coterra and a $2.6 billion acreage payment inside it — a hard quarter to read cleanly. The third quarter is the first with three full combined months, the first with a full quarter of repurchases under the new authorization, and the first at which the roughly $200 million 2026 synergy exit rate can be checked against a partial-year print. Fourth-quarter 2026, reported in February 2027, is where the exit rate itself is verifiable.
Instrument facts
These are facts about listed instruments, recorded as facts. Nothing here is a recommendation, and no strike or expiry is named as a choice.
- Long-dated listed options exist. Cboe delayed options quotes for DVN, timestamped 1 August 2026, list 14 expiries running from 7 August 2026 to 15 December 2028. Two clear twelve months: 21 January 2028, 537 days out (17.6 months), and 15 December 2028, 866 days out (28.4 months). Each carries 42 listed strikes.
- Open interest. Total open interest across all listed expiries is approximately 517,000 contracts. At the January 2028 expiry it is 20,715 contracts; at the December 2028 expiry, 8,595 contracts. For scale, the September 2026 and August 2026 monthly expiries carry roughly 119,000 and 122,000 contracts respectively. Long-dated open interest is therefore present but thin relative to the front of the curve — under 6% of the total sits beyond twelve months.
- Implied volatility. AlphaQuery reports DVN 30-day mean implied volatility of 41.5% and 180-day mean implied volatility of 38.4%, both as of 31 July 2026. In the Cboe file, at-the-money implied volatility is approximately 37.6% at the January 2028 expiry and approximately 38.3% at December 2028; the 7 August weekly prints near 50%, reflecting the 4 August earnings date. Against the framework's reference lines — up to roughly 50–55 acceptable, 60–70 elevated — the long-dated level sits below the acceptable band, and the elevated front-week reading is an earnings artefact that decays within the week.
The framework's watchlist-only case, which applies when no qualifying long-dated options exist, does not apply to Devon.